Three indicators can reveal SME insolvency risk up to four years in advance

Three indicators can reveal SME insolvency risk up to four years in advance

September 24 2019
  • Most insolvencies of European SMEs & MidCaps do not come as a surprise. In fact, they are typically the consequence of ongoing corporate distress over several years. Looking at 1,653 companies in Germany, France, Italy and Spain, we identify three phases, each different in type and length: a strategy crisis, a profitability crisis and then a solvency crisis. Once the profitability crisis sets in, corporate distress can be detected and observed by a systematic analysis of a company’s financial situation.
  • In all four countries, the mean financial profile of all the insolvent companies we analysed was relatively low four accounting years prior to insolvency. German companies attained a mean financial profile of less than BB-, while the French, Italian and Spanish firms scored around B+. By the last accounting year before the insolvency, the scores decreased considerably down to below B+ in Germany, B- in France and around CCC in Italy and Spain. In comparison, the mean financial profile of all SMEs & MidCaps in the four countries is about BB.
  • Which leading indicators could allow us to detect corporate distress early? The literature often identifies a decline in turnover as an initial symptom, but our analysis shows that turnover development is not a robust indicator of corporate distress or increased credit risk in Germany. While it looks more effective in France, Spain and Italy, it’s not fully reliable. Instead, we find three indicators which can point to corporate distress three to four years before an insolvency.
  • The first and most important indicator is profitability. Four years prior to an insolvency, the average Return on Capital Employed (ROCE) is relatively weak: around 7% for German SMEs, 6% for French SMEs and below 4% for Spanish SMEs. In Italy, ROCE is almost close to 0%. In comparison, the average ROCE of all SMEs & MidCaps in the four countries is between 10% and 14%. As corporate distress unfolds, companies' profitability decreases significantly, falling deep into negative territory one year before an insolvency.
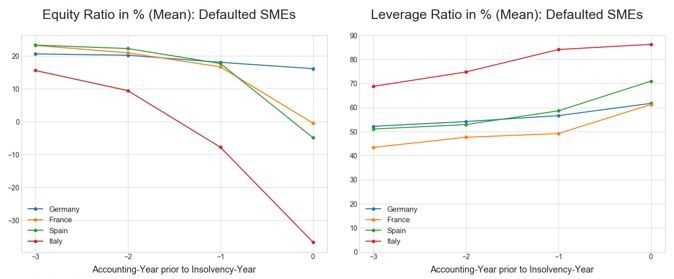
  • The second indicator is capitalization, which tends to decline along with the decline in earnings, albeit at a slower pace. Four years before their insolvency, companies have average equity ratios of 20.6% (Germany), 23.2% (France), 15.6% (Italy) and 23.3% (Spain). In comparison, the average equity ratio of all SMEs & MidCaps is about 30%. Capitalization deteriorates significantly in the last year prior to insolvency, resulting in over-indebtedness in all countries except Germany. As earnings and capitalization deteriorate, the resulting negative impacts on credit risk clearly affect the deleveraging potential[4] as well.
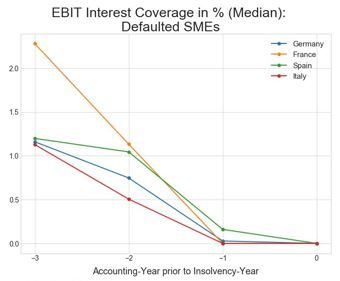
  • The third indicator for corporate distress is the interest coverage. As early as three accounting years before an insolvency, companies’ average EBIT-based interest coverage is very weak: between 0.5x in Italy, 0.8x in Germany, 1.0x in Spain and 1.1x in France. Compared to this, the average interest coverage of all SMEs & MidCaps is about 3x. In other words, at this early stage, operating profits are already or close to being unable to cover interest expenses.

In most European countries, the number of corporate insolvencies has risen slightly since 2018 after several years of steadily declining or staying low. It is still not clear whether this shift represents a full-fledged trend reversal, but to us that seems to be the case, given the weakening economy and growing pressure for change due to ongoing structural shifts. While insolvencies ought to increase gradually and not spike all at once, absent an exogenous shock, companies, lenders and investors should look more closely at the credit risk component of their decisions going forward. In this paper, we identify how the insolvency risks of SME & MidCaps can be detected at an early stage, starting with the typical pattern of corporate crises. The findings are based on a statistical analysis of insolvent European SMEs & MidCaps in Germany, France, Italy and Spain.

SMEs & MidCaps go through three phases of corporate distress prior to insolvency

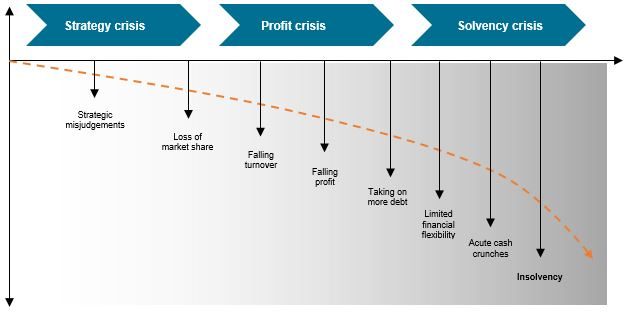
Most insolvencies of European SMEs & MidCaps do not come as a surprise. In fact, they are typically the consequence of ongoing corporate distress over several years, which can be detected by a systematic analysis of a company’s financial situation. We identify three phases companies go through, each different in type and length, before facing an acute insolvency risk (see Figure 1): a strategy crisis, a profitability crisis and then a solvency crisis.

In the first phase, companies still have a relatively wide range of strategic options available to cope. However, if they fail to recognize the situation, the corporate distress will intensify and their available options will shrink substantially as they enter and move through the second phase. In the final phase, their options tend to be so limited that it becomes extremely difficult to avoid a potential default.

Figure 1: Phases of corporate distress
Source: Euler Hermes Rating GmbH

The strategy crisis describes a situation in which companies are at risk of losing former success factors without being able to replace them yet. Such a scenario can be triggered by changes in customers’ consumption and purchasing habits, technological changes, the market entry of new competitors or political and legislative changes, along with strategic misjudgements by management regarding these factors. By this definition, many SMEs & MidCaps – particularly those in dynamic, competitive industries – may always be operating on the edge of the strategy crisis. It often appears obvious in retrospect but is usually difficult to detect while it is happening because it has no immediate impact on the company’s financial situation. In addition, making strategic decisions amid uncertainty about the future development of sales markets is one of the core functions of business management. Therefore, identifying whether a decision has been a strategic misjudgement or not is only possible ex post facto or requires an exhaustive, independent analysis of the market- and competitive environment and the company’s strategic alignment, respectively.

If a company’s success factors get lost without substitution, the strategy crisis will inevitably lead to the next phase, known as the profitability crisis. This phase, which can be seen as a manifestation of an inappropriate strategy, tends to be shorter and more serious than the previous one. An often stated initial symptom or conspicuous side effect of a profitability crisis is a significant negative trend in turnover, either as a consequence of market shrinkage or a decline in market share. However, many companies respond to it by launching costly sales programs for new or existing products that may keep turnover from falling. In these cases, a profitability crisis manifests itself in the form of declining operating profits, shrinking cash flows and – in some cases – decreasing capacity utilisation and postponed investments. Changes in the accounting policy may also indicate a profitability crisis in some circumstances.

While distress obviously has to be detected first before strategic actions can be taken, there is of course no guarantee that the company will make the right adjustments or that outside observers will fully grasp the company’s situation. A company may for example make forward-looking, strategically sound decisions that will necessarily result in a temporary profitability crisis. Thus, it is also essential in this phase to analyse the underlying strategy crisis, the company’s response to it and the corresponding market conditions. While companies generally have a relatively wide range of options at the beginning of a profitability crisis, their options gradually decrease as the distress progresses and their financial burdens grow, which can make strategic adjustments more difficult. Moreover, companies in this phase are very vulnerable to negative economic factors that can dramatically accelerate the distress process.

If the company’s strategy remains in conflict with its market environment, the profitability crisis will segue into the third phase, the solvency crisis. According to our observations, indicators of an incipient solvency crisis include increased borrowing against credit lines, a significant increase in financing activity, changes in payment practices or avoidance of necessary investments. As the distress further progresses, it is followed by acute cash shortfalls that may force the company to fall behind on its payments and thus become insolvent. During this phase, the management’s focus typically is or clearly should be on preventing acute liquidity shortfalls rather than strategic adjustments. This also applies to the external analytical perspective, while a company faces an acute solvency crisis.

The development of the financial profile reflects the unfolding of corporate distress

Our analysis is based on a dataset containing more than 250,000 German, French, Italian and Spanish SMEs & MidCaps, from which we identified a total of 1,653 insolvent companies with a data history of four years or more. As the analysis is based on the respective point in time of the insolvency of companies, the following results can refer to different time periods.

Table1: Panel of companies used in our analysis
-
Source: Euler Hermes Rating GmbH
Our analysis finds three indicators which point to corporate distress three to four years before the bankruptcy: profitability, capitalization and interest coverage ratio (see Figure 3).
Table 2: Leading indicators for corporate distress four years prior to insolvency
Source: Euler Hermes Rating GmbH

Once a company enters the profitability crisis phase, its financials begin to visibly show the impact of the underlying strategy crisis. A systematic analysis and evaluation of its financial profile is essential to gain a detailed understanding of the speed and severity of the financial deterioration and the associated increase in default risk that occurs as the corporate distress progresses.

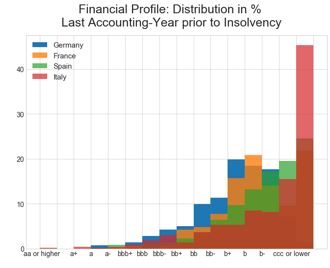
Figure 2 shows the financial profiles in the years preceding an insolvency of SMEs & MidCaps in Germany, France, Italy and Spain.

Figure 2: Financial profile: Defaulted SMEs & MidCaps
Source: Euler Hermes Rating GmbH
The mean financial profile of all insolvent companies from the dataset was relatively low four accounting years prior to insolvency in all four countries. German companies attained an average score of less than BB-, while the French, Spanish and Italian firms scored around B+. By the last accounting year before insolvency, the average scores decreased considerably down to below B+ in Germany, B- in France and around CCC in Spain and Italy. In comparison, the average financial profile of all SMEs & MidCaps in the four countries is around BB.
Figure 3: Financial profile distribution: Defaulted SMEs & MidCaps
Source: Euler Hermes Rating GmbH

A review of the financial profile that expresses the companies’ aggregated financial risk and, in addition, an assessment of the individual components that go into the score (see below) show that these companies have already entered a profitability crisis at the beginning of our analytical period and exhibit a continuous increase in financial risk as the distress unfolds. This ratio-based analysis does not capture financial flexibility, which typically decreases throughout this process, and so an additional assessment of financial flexibility can make forecasts of corporate default risk even more accurate.


Profitability is a leading indicator of corporate distress

As mentioned above, one of the often stated side effects of a profitability crisis is a decline in turnover, either as a consequence of market shrinkage or because the company loses market share. However, companies regularly initiate expensive sales programs aimed at keeping capacity utilisation high, thereby resulting in stable or even increasing turnover. In both cases, however, shrinking contribution margins reduce a company’s earnings power.

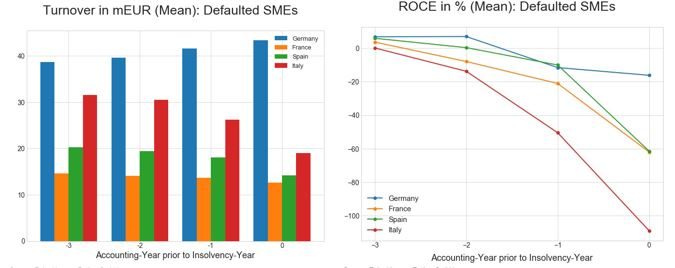
Figure 4: Turnover and profitability
Source: Euler Hermes Rating GmbH

While the average turnover of defaulted SMEs & MidCaps in Germany remains relatively stable up to the accounting year before insolvency, the average turnover of French, Spanish and Italian companies declines with time, as one might expect. However, the turnover development in itself is not a very robust indication of default risk. The turnover, for example, may also decrease as a result of deliberately eliminating low-margin products, thereby improving the company’s earnings power and creditworthiness.

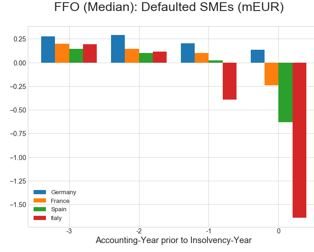
An additional analysis of changes in earnings power reveals that the profitability of defaulted SMEs is already weak at the start of the surveyed period. Four years prior to insolvency, the average return on capital employed (ROCE) is already insufficient at 6.9% at German companies, 6% at Spanish companies and 3.7% at French companies. Italian companies in the dataset are already barely able to break even at this early phase. Their average ROCE is a mere 0.2%. Earnings power drops off significantly in subsequent years and ends up deep in negative territory in all four countries in the last year before insolvency, with the Italian companies showing the greatest deterioration in the course of distress (Germany: ‑16%; France: ‑62%; Spain: -61.5%; Italy: -109%). Compared to this, the average ROCE of all SMEs & MidCaps is 12% in Germany and France, 14% in Italy and 10% in Spain. Weak and/or diminishing earnings power directly affects cash flow generation and is therefore a key indicator of increased credit risk. This proposition is backed up by an analysis of the average funds from operations (FFO).

Figure 5: Funds from operations (FFO)
Source: Euler Hermes Rating GmbH

Early detection of potential default risk requires a timely analysis of the reasons why earnings power has decreased. Only then can strategic adjustments be made before the corporate distress further accelerates.


Capitalization and leverage follow the decline in profitability

Declining or even negative profits and cash flows often force companies to take on additional debt to cover the costs of operating the business or making necessary investments. As a consequence, a decrease in profits or cash flows generally results in a notable deterioration of a company’s capital structure as corporate distress gets worse.

Figure 6: Capitalization
Source: Euler Hermes Rating GmbH
As can be seen in our dataset, the average leverage ratio of defaulted SMEs & MidCaps rises significantly (more than 10% in Germany and more than 20% in France, Spain and Italy) during the surveyed period up to insolvency. The average equity ratio slowly deteriorates in the first two years of observation in Germany, France and Spain, but drops sharply during the last year before insolvency in France and Spain, leading to over-indebtedness, ending up at -0.4% in France and -4.8% in Spain. German SMEs default on average at an equity ratio of 16.1%.  In Italy, the distress intensifies much more quickly with a much stronger decline of the average equity ratio of Italian SMEs (-36.6%) and a significantly higher leverage ratio of close to 90%. In comparison, the average equity ratio of all SMEs & MidCaps is 29% (Germany), 32% (France), 28% (Italy) and 39% (Spain).
Figure 7: Leverage
Figure 7: Leverage
Source: Euler Hermes Rating GmbH

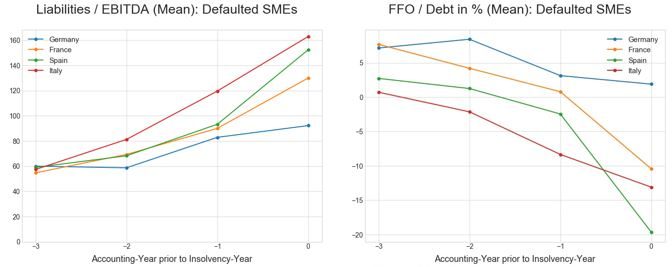
The increase in credit risk resulting from the simultaneous deterioration of earnings power and capitalization is also reflected in the companies’ deleveraging potential. The average ratio of liabilities-to-EBITDA is already highly unsatisfactory for defaulted SMEs in Germany (60x), France (54x), Spain (59x) and Italy (57x) in the fourth accounting year prior to insolvency. The deleveraging potential further decreases substantially in subsequent years up to insolvency. The average liabilities-to-EBITDA ratio thus climbs to 92x in Germany, 129x in France, 152x in Spain and 162x in Italy. In contrast, the average liabilities-to-EBITDA of all SMEs & MidCaps is 48x (Germany), 35x (France), 38x (Spain) and 33x (Italy). A comparable pattern can also be seen in the development of the FFO / Debt in the four countries. The structure of deleveraging potential, and particularly any changes in it, generally have considerable discriminatory power and are therefore good indicators of SME & MidCaps default risk.


Interest coverage significantly declines before insolvency

The interest coverage ratio also further decreases significantly in the years leading up to a default due to the ongoing decrease in earnings power and the increase in debt, which further destabilizes these companies and makes them highly vulnerable to any additional negative impact.

Figure 8: Interest coverage and current ratio
Source: Euler Hermes Rating GmbH
The average EBIT-based interest coverage ratio for defaulted SMEs & MidCaps in Germany, Spain and Italy is already very poor between 1.1x and 1.2x in the fourth accounting year before insolvency. Compared to this, the average interest coverage of all SMEs & MidCaps is 2.6x (Germany), 3.8x (Italy) and 3.5x (Spain). In France, the level of interest cover is not directly comparable, as the interest expenses are partly reported differently. A year later, those companies in Germany and Italy are on average already unable to cover their interest expenses with their operating profits. At this stage, it becomes more and more important to closely observe and analyse the liquidity situation of those companies.
Director, Credit Risk, at Euler Hermes Rating
Head of Macroeconomic Research
ana.boata@eulerhermes.com