In line with the economic slowdown, companies preemptively reduced payment delays, except for Mediterranean countries

In line with the economic slowdown, companies preemptively reduced payment delays, except for Mediterranean countries

May 09 2019
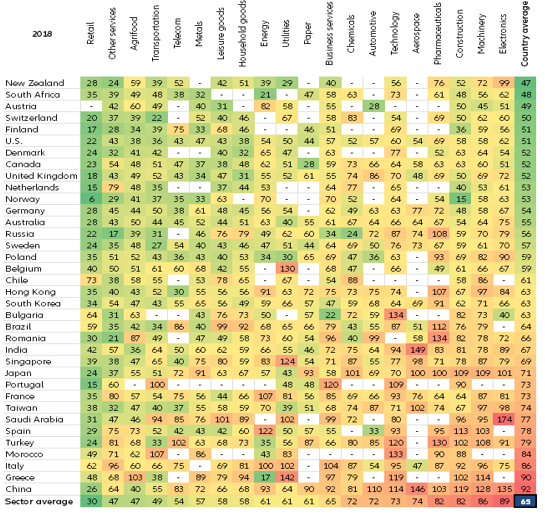
  • After hitting a 10-year high in 2017, global average Days Sales Outstanding (DSO), a measure of how long it takes companies to collect cash from customers, fell by -1 day to 65 days in 2018, a sign of caution in line with the economic slowdown. As world GDP growth slows further this year, we expect DSO to reach 64 days in 2019.
  • In China, one in four companies is paid after four months. While Chinese companies managed to reduce their DSO by -1 day in 2018, they still recorded the longest average payment term at 92 days, mirroring their important role as “invisible banks” at a domestic level and for the rest of Asia as well. Mediterranean countries are back to their bad habit of paying late: Italy, France, Greece and Spain saw their average DSO lengthen by +5 days, +2 days, +2 days and +1 day, respectively, in 2018.
  • Companies in sectors closer to consumers experienced longer payment terms in 2018: household goods (+1 day), agrifood (+1 day), transportation (+1 day), pharmaceuticals (+1 day) and telecom (+1 day). On the contrary, in industrial sectors where DSO is already high, such as construction (- 3 days), electronics (-2 days), technology (-2 days), machinery (-1 day), energy (-2 days) and chemicals (-1 day), companies’ fears of not being paid on time by clients pushed them to reduce payment terms. 

Summary Heatmap

Summary Heatmap

Source: Euler Hermes

Declining DSO to mirror self-discipline of companies alongside global growth deceleration

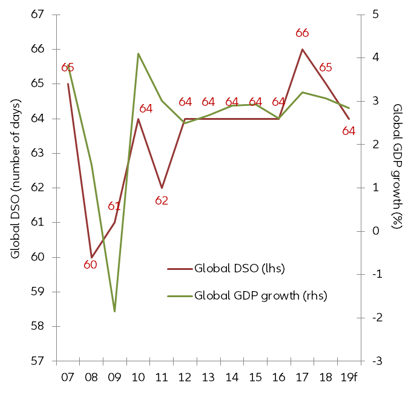
In 2017, the re-acceleration of world economic growth led to a noticeable rise (+2 days) in global average Days Sales Outstanding (DSO) to a 10-year record high, which we attributed to companies placing greater trust in customers, supported by a better economic and financial background. Phases of global growth acceleration are generally accompanied with a relaxation in payment discipline, which can be associated with an easing of credit conditions. Yet the world economy registered a significant shock of uncertainty in 2018 as the US government initiated a wave of protectionist policies. As a result, global growth started to decelerate and DSO dropped by -1 day to 65 days in 2018, a sign of companies taking a cautious approach to their clients’ payment behavior. Figure 1 shows that when GDP growth is sound, companies are less worried about their DSO as they see their revenue rise and therefore face less stringent conditions in terms of cash being available for their activity. Conversely, B2B credit conditions usually tighten when global growth weakens, re-activating the need for payment discipline. We expect global growth to decelerate in 2019 at 2.9% y/y compared with 3.1% y/y in 2018. As a result, DSO is likely to continue its downward trend to hit 64 days on average in 2019.

Figure 1: Change in global DSO and GDP growth

Figure 1: Change in global DSO and GDP growth

Sources: Global Insight, Euler Hermes forecasts

China tops the list once again

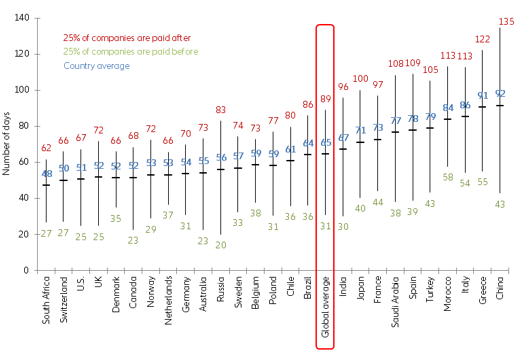
In China, one in four companies is paid only after four months. While it managed to reduce its DSO (by -1 day in 2018 vs. 2017), China has once again recorded the longest average payment term in the world, at 92 days. This high level of DSO reflects the role of Chinese companies as “invisible banks” at a domestic level and also for major trade partners. This is consistent with a less mature and less open financial system, a higher weight of shadow banking and higher difficulties for small- and medium- sized companies in the private sector in accessing credit. Two other important Asian countries, Japan and India, also saw their DSO rise above the world average to 71 and 67 days, respectively. This kind of pattern could reflect a regionalization of the economic cycle in Asia, better insulated from global growth deceleration.

China is followed by Mediterranean countries, including Greece (91 days), Italy (86 days), Morocco (84 days), Turkey (79 days), Spain (78 days) and France (73 days).

Figure 2: DSO level and dispersion by country in 2018

Figure 2: DSO level and dispersion by country in 2018

Sources: Bloomberg, Euler Hermes

A North–South divide emerges when looking at the change in DSO

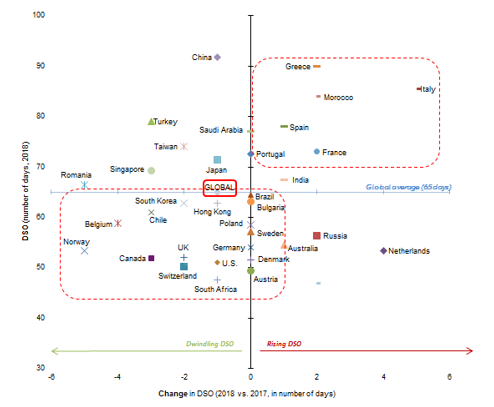
North America has succeeded in shortening its DSO, meaning that its companies have performed very well, especially in Canada. Looking at changes in DSO between 2017 and 2018, we identify two clear clusters:

Mediterranean countries, which are lagging behind (Figure 3, top right): DSO in Italy, France, Greece and Spain must be watched carefully as the trend is clearly heading down the wrong path. Domestic companies are back in in the bad habit of getting paid late by their customers. This is a worrying signal as both public and private debt fundamentals remain deteriorated, while global growth and trade are decelerating. This could be another illustration of the delay traditionally taken by European economic actors in adapting to new trends in the global economic cycle.

Nordic countries and North America, which are ahead (Figure 3, bottom left): Canada and the U.S. have registered a decline of their DSO in 2018 despite levels being structurally lower compared with the rest of the world. This reflects cultural preferences, the fact that companies are cash rich and possibly the fact that companies are much more forward-looking compared to their European partners. Meanwhile, Norway, Sweden, the UK, Germany, Poland and Belgium have got away with shorter DSO in spite of weakening economic conditions. They have succeed in maintaining the payment discipline of their customers, anticipating an upcoming deceleration of growth and adapting to rising difficulties in the car industry. 

Figure 3: DSO and change in DSO by country (36 countries) 

Figure 3: DSO and change in DSO by country (36 countries)

Sources: Bloomberg, Euler Hermes

Outside these clusters, the Netherlands saw a noticeable deterioration of its DSO (+4 days in 2018) but stayed under the global average. Australia also had DSO lower than the global average as a result of the drop in most commodity prices over the last year. Meanwhile, the economic slump in Turkey shortened DSO by -3 days. Turkish companies are clearly trying to secure their cash balances by getting paid quickly. Both in the UK and Turkish cases, the decline of DSO is in line with tightening credit conditions, which traditionally accompany macroeconomic contexts being characterized by an extremely high level of uncertainty.

B2C and B2B sectors have to deal with diverging DSO destiny; retail is an outlier

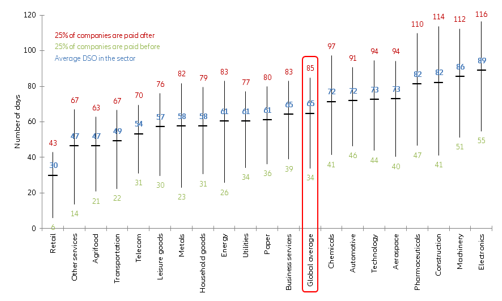
Figure 4: DSO level and dispersion by sector in 2018

Figure 4: DSO level and dispersion by sector in 2018

Sources: Bloomberg, Euler Hermes

In 2018, the electronics, machinery and construction sectors continued to suffer from the longest DSO with 89 days, 86 days and 82 days, respectively, on a yearly average, well above the global average of 65 days. 

The construction sector is currently experiencing difficulties at a global level as evidenced by the multiplication of major insolvencies (51 in 2018). Looking at the level of DSO, electronics is also at a high level as the size of investment in a context of rising competition and the domination of B2C business models oblige companies to be more lenient with their economic partners. High DSO are also visible in the machinery sector as their clients have to take a longer time in generating revenues in order to repay large size types of investment.  

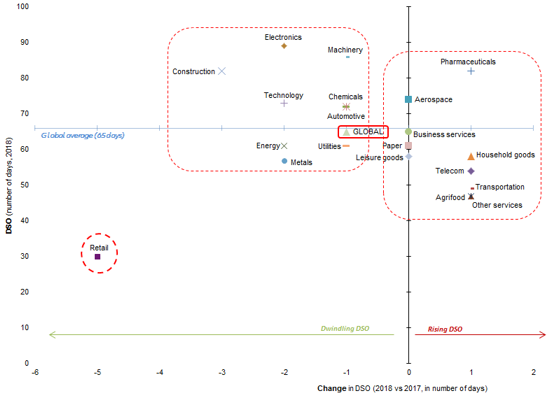
Figure 5: DSO and change in DSO by sector (20 sectors)

Figure 5: DSO and change in DSO by sector (20 sectors)

Sources: Bloomberg, Euler Hermes

Looking at the change in DSO, we again identify two clusters:

  • B2C industries show DSO changes being above the global average (Figure 5, right): Companies in the transportation, household goods, agrifood and telecom sectors have a higher capacity, compared with B2B, to impose new terms of payments when needed. So they are more likely to grant longer terms of payments for commercial reasons if they consider the cycle as not being too deteriorated. Indeed, in a macroeconomic perspective, as we are in a late phase of the cycle, and as they are exposed with a delay to economic fluctuations, B2C companies can be incited to continue proposing laxer terms of payment. The case of pharmaceuticals is a little specific. Drug makers often suffer from high level of DSO but this situation is linked to their customer base dealing mainly with public health insurance systems. Fortunately, laboratories are usually awash with large cash hoards and can afford an extended length in DSO level accordingly. 
  • B2B industries have DSO changes being below the global average (Figure 5, left): Construction, machinery, metals and energy, as well as electronics are more directly and in an earlier manner impacted by the fluctuation of the economic cycle. Those kinds of companies and sectors are more cyclical by nature. They have already observed a global deceleration of growth, meaning upcoming economic hardship; as a result, companies fearful of being paid too late shortened their DSO in 2018. Chemicals and automotive have got away with stable DSO levels in spite of accumulating hurdles for car makers dealing with tightening new pollution standards.

An outlier: Retail has to be watched carefully even though it shows the lowest DSO level compared to all other sectors. Retail’s DSO plummeted by -5 days on average last year. As the sector’s business model is turning upside down, it has strongly tightened up its overdraft facilities. This tightening might go upstream to affect the main supplying sectors by possibly forcing them into granting higher DPO to retailers.   

Sector Advisor for Chemicals, Pharmaceuticals, Transportation, Agrifood and Transport Equipment
marc.livinec@eulerhermes.com
Head of Sector and Insolvency Research
maxime.lemerle@eulerhermes.com