Europe’s low interest rates have an impact – but not the way you think

Europe’s low interest rates have an impact – but not the way you think

November 07 2019
  • The prevailing debate about zero and negative interest rates is increasingly focused on long-term negative effects: inequality, poverty in old age, zombie companies and financial market bubbles.
  • In contrast, we calculate the direct effects of the European Union’s (EU) interest rate developments on each economic actor by using the net interest income (interest payments received minus interest payments made); particularly, we cumulate the annual changes from 2008 – the year in which the European Central Bank's (ECB) current easing cycle began – to 2018.
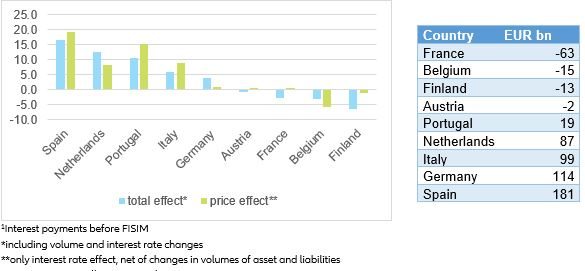
  • ·The results are quite surprising: the overall benefit of low interest rates is neither equally distributed nor follows the North-South divide. Among the major beneficiaries are not only Spain (+16.5% of GDP or EUR 181bn) and Portugal (+10.4% or EUR 19bn) – as expected – but also the Netherlands (+12.7% or EUR 87bn) and, to a lesser extent, Italy (+5.9% or EUR 99bn) and Germany (+3.9% or EUR 114bn). On the other hand, Finland (-6.4% or EUR -13bn), Belgium (-3.0% or EUR -15bn) and France (-2.9% or EUR -63bn) are unexpectedly on the losing side.
  • Furthermore, the development of net interest income varies also greatly from sector to sector. Three observations are particularly striking:
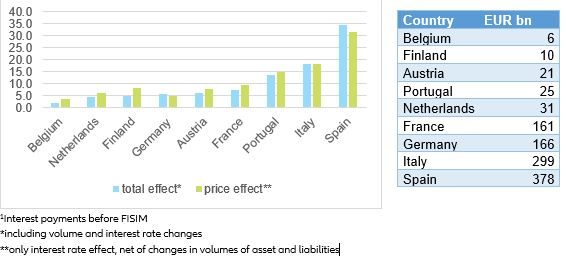
    • Firstly, only non-financial companies have consistently benefited from the low interest rate environment. Highly indebted companies in Southern Europe saw particularly large positive effects, ranging from 13.5% of GDP in Portugal (EUR 25bn) and 18% in Italy (EUR 299bn) to 34.5% in Spain (EUR 378bn).
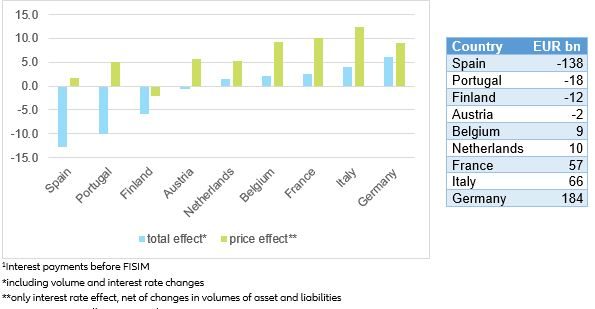
    • Secondly, not all governments were able to benefit from the fall in interest rates. Rising debt levels in some countries have eaten up the savings from lower interest rates. Germany has improved its (negative) net interest income the most (+6% of GDP or EUR 184bn), as the decline in interest rates has been accompanied by debt restraint. On the other end of the spectrum sits Spain: Its public net interest income deteriorated by 12.7% (EUR -138bn) as public debt increased threefold.
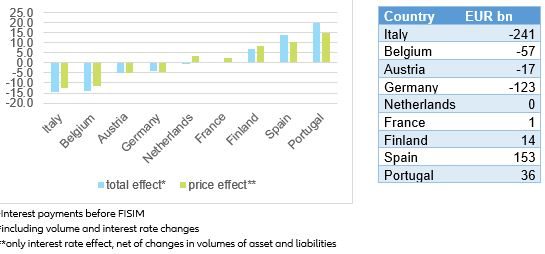
    • Thirdly, the situation of private households is very heterogeneous, driven by behavioral changes, the proportion of savings and debt and the pass-through of interest rate cuts on the credit side. All these factors led to German households suffering from low interest rates – to the tune of 4.2% of GDP (EUR -123bn) – while Spanish (+14.1% or EUR 153bn) and Portuguese households (+20% or EUR 36bn) benefited the most.
  • All results can be replicated with the “Allianz Net Interest Income Calculator”, which measures the net interest income of the four main actors (government, households, non-financial companies and financial corporations) in the individual euro countries since 2002.

What do we measure when we measure net interest income

Net interest income is the difference between interest income (e.g. household interest income from bank deposits and bonds) and interest expenses (e.g. household interest payments on loans).

For the “Allianz Net Interest Income Calculator”, we use interest payments before Financial Intermediation Services, Indirectly Measured (FISIM, see box below) and take changing volumes into account. This is because there have been changes in volumes in recent years, in some cases drastic, also as a conscious reaction to the low interest rate environment.

We measure the net interest income of the government, households, non-financial companies and financial corporations in the individual Eurozone countries from 2002 to 2018. More specifically, to capture the development since the start of the current monetary easing cycle, we cumulate the annual changes against the year 2008 and express the sum as percentage of GDP. This way, we are able to gauge the impact of the low-yield environment in just one key number.

Box: What is FISIM?

The national accounts refer to two forms of interest income and expense: before and after "FISIM", which stands for "Financial Intermediation Services, Indirectly Measured". This is calculated by adding/deducting the indirect fees charged by banks as part of their lending and deposit business, calculated using models, to/from the interest payments actually made.

In other words, the national accounts assume that interest payments consist of two components: the "pure" interest and the price for the banking service (e.g. loan processing, deposit management, etc.). This is why, for example, the interest income of private households is much higher after FISIM – after all, this income also settles any service fees relating to account management which the banks, however, conveniently withhold right away (which is why they are referred to as indirect fees). Interest expenses, on the other hand, are much lower, because part of the interest payments “actually” refer to the service fees for loan processing (which, however, are not directly reported by the banks).

The differences between the interest measurement before and after FISIM are by no means trivial, as, for example, a glance at the German national accounts for 2018 reveals: According to these statistics, private households were faced with interest expenses of EUR 52.8 billion and earned interest income of EUR 10.9 billion in that year. In contrast, the figures after taking indirect bank fees into account are interest expense of EUR 20.1 billion and interest income of EUR 29.0 billion. This means that FISIM turns net interest income that is well in the red (EUR -41.9 billion) into a sizeable surplus (EUR +8.9 billion). This shows that the method used to calculate interest has a considerable impact on the result of the calculations.

For the purposes of our analysis, to assess the impact of low interest rates on household finances, we do not believe that it makes much sense to look at interest income and expenses after the allocation of financial intermediation services indirectly measured. While this sort of break-down might be consistent with the logic behind the national accounts, in the sense that it facilitates an estimate of the contribution to added value made by the banking sector, it does not reflect the reality of life for savers in any way. After all, savers do not live in a theoretical world; they are not interested in what could have been credited to their account at the end of the year if the indirect banking services had been taken into account. Rather, they are only interested in the funds that actually end up in their account. The same applies to their interest expenses, which no saver is likely to break down into pure interest payments and fees in his head (after all, what formula would she use?). What is relevant is the amount that has to be paid to the bank every month.

Non-financial corporations – always on the sunny side

Only non-financial companies have been able to consistently benefit from the low interest rate environment (see Figure 1). On the one hand, this reflects their role as net borrowers, but on the other hand it also reflects the fact that long fixed-interest periods are hardly widespread in the lending business with companies, and that interest rate cuts can be passed on so quickly. In all countries (except for the Netherlands), interest rates were more than halved since 2008; in Spain, they dropped by 3.7 percentage points and in Portugal by a whopping 5.3 percentage points.

The extent to which companies could lower their interest burden, however, also depended heavily on the adjustment of debt levels. Spanish companies, for example, reduced their loans by almost 20%; in Italy and Portugal, debt levels remained flat over the last decade. As a result, companies from these three countries saw the biggest improvements in their net interest incomes. On the other hand, gains from lower interest rates were almost completely eaten up from rising debt levels in the case of Belgian companies, particularly in the last couple of years when net interest income started to deteriorate again.


Figure 1: Non-financial corporations | Cumulated changes in net interest income1 from 2008 to 2018, in % of annual GDP and EUR bn
Figure 1: Non-financial corporations | Cumulated changes in net interest income1 from 2008 to 2018, in % of annual GDP and EUR bn
Sources: Eurostat, Allianz Research.

Financial corporations – feeling the squeeze

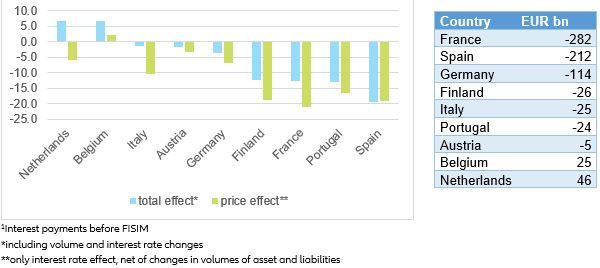
In contrast to the situation of the corporate sector, financial corporations, mainly banks, had to cope with deteriorating net interest incomes (see Figure 2). This was because of subdued loan growth and more pronounced declines in rates on the asset (i.e. loans and bonds) side rather than the liability side (i.e. deposits), leading to a margin squeeze (negative price effect). Spanish banks, in particular, were hard hit as loan volumes even contracted. Italian banks, on the other hand, were able to cushion the blow from the corporate business by piling into domestic governments bonds, which for most of the decade yielded still decent returns.

Only Dutch and Belgian banks were able to improve their net interest incomes. In the case of the Netherlands, this was mainly due to an increase in assets, combined with relatively stable margins. Belgian banks, on the other hand, were the only ones that succeeded in widening their margins over the time span in focus (positive price effect).

Figure 2: Financial corporations | Cumulated changes in net interest income1 from 2008 to 2018, in % of annual GDP and EUR bn
Sources: Eurostat, Allianz Research.

Governments – piling into debt

Somewhat surprisingly, not all governments were able to improve their net interest income, despite the steep fall in interest rates since the financial crisis (see Figure 3, positive price effect). The reason: Debt levels were rising everywhere – and in some places quite dramatically. In Spain, for example, public debt increased threefold; in Portugal and Finland, it doubled. These rising debt levels ate up the savings from lower interest rates.

The German state, however, sits on the other end of the spectrum. Nowhere was the fall in interest rates steeper – rates were slashed by two thirds – and nowhere was debt growth more shallow, clocking an increase of 35% since 2008. As a result, Germany was able to improve its (negative) net interest income the most among all the countries in focus. Surprisingly, the Italian state was the second most parsimonious in the last ten years, with public debt increasing by “only” 46%. Although the decline in interest rates was not as pronounced as in Germany – rates were less than halved – this kind of debt restraint was enough to trigger a sizeable interest burden relief.

Figure 3: Governments | Cumulated changes in net interest income1 from 2008 to 2018, in % of annual GDP and EUR bn
Figure 3: Governments | Cumulated changes in net interest income1 from 2008 to 2018, in % of annual GDP and EUR bn
Sources: Eurostat, Allianz Research.

Households – not the usual suspects

The situation of private households in the Eurozone is very heterogeneous (see Figure 4). In no other grouping is the influence of behavioral change likely to play a greater role. A case in point is the marked deterioration in the net interest income of Italian households: The main trigger was the accelerated reduction of the large bond portfolio, leading to an overall reduction in interest-bearing assets of 12%; in fact, Italian households are the only ones in the Eurozone that own less assets at the end of 2018 than in 2008. Add to this the strong decline in interest rates (-67%) and the result is an interest income that has fallen by 70% since the financial crisis. Although paid interest also dropped significantly, by 52%, net interest income almost disappeared, falling by 90% to just EUR 4bn. With that, however, Italian households can (still) boast a positive net interest income – also unparalleled in the Eurozone – owing to the fact that assets are more than twice as big as liabilities, by far the highest asset-liabilities relation. Even the “thrifty” households in Belgium (relation of 1.6), Austria (1.5) and Germany (1.4) do not come close. The Italian state may be over-indebted, but Italian households are clearly not.

However, households in Belgium, Austria and Germany, too, find themselves on the losing side. The “asset-overhang” certainly played a role in this, leading to a negative price effect. Adding insult to injury was the fact that interest rates on deposits and bonds declined faster than those on loans, particularly in Belgium, where received interest rates were slashed by 83% and paid ones by “only” 37%. Blame this on a preference for liquid investments and long fixed-interest periods for mortgage loans, which delay the pass-through.

The big winners are Finnish, Spanish and Portuguese households. Besides positive price effects, the decisive trigger for the latter two was the reduction in liabilities, by 21% (Spain) and 14% (Portugal). As a result, both countries’ households were able to turn a debt-overhang into an asset-overhang in just ten years. Furthermore, in both countries, loan interest rates declined by more than deposit rates, not least because they started from an elevated level of above 6%; today, these rates are just a little above 2%. The Finnish story is slightly different. Finnish households have a big debt-overhang – liabilities are more than 50% higher than assets – combined with the steepest fall in interest rates on loans.

Meanwhile, Dutch households are the most indebted in the Eurozone: their liabilities are almost twice as high as assets. This should be a “good” position to benefit from falling interest rates, which do good to borrowers but harm to savers. However, as volumes as well as interest rates of liabilities and assets moved more or less in sync, net interest income did not change much over the last ten years. In contrast, French households (still) have a modest asset-overhang. And interest rates on loans have recently started falling fast. Whereas in the immediate aftermath of the financial crisis paid interest remained more or less flat and received interest fell, resulting in a deterioration of net interest income, in recent years the picture has changed: paid interest is declining fast, leading to an improvement in net interest income. So, French households switched during the last decade from the losing side to the winning one, with the overall effect being zero.

Figure 4: Households | Cumulated changes in net interest income1 from 2008 to 2018, in % of annual GDP and EUR bn
Sources: Eurostat, Allianz Research.

Overall Eurozone economy – beyond the North-South divide

In view of these very different effects, it is hardly surprising that the overall benefit of low interest rates is neither equally distributed nor follows the North-South divide (see Figure 5). Spain and Portugal – as expected – are not alone among the major beneficiaries; this list also includes the Netherlands (+12.7%). In the latter case, this is mainly due to the banks that succeeded – contrary to the general trend – in expanding their lending businesses.

This list of “winners” is completed by Italy – where non-financial companies were the main drivers, more than compensating the losses of households – and Germany. Although the criticism of low interest rates is loudest in Germany, all in all, the country has benefited, too, thanks mainly to the interest savings of the state. The corollary: If there were a political will to do so, the consequences of low interest rates for the groupings concerned – first and foremost households – could at least be mitigated; the state has to just re-distribute the windfall profits of low interest rates.

On the other hand, Finland (-6.4%), Belgium (-3.0%) and France (-2.9%) are surprisingly on the losing side. While in France and Finland it was mainly the weak development of banks’ net interest income that is to blame, in Belgium it was the deterioration in net interest income of private households.

Figure 5: Total economy | Cumulated changes in net interest income1 from 2008 to 2018, in % of annual GDP and EUR bn
Figure 5: Total economy | Cumulated changes in net interest income1 from 2008 to 2018, in % of annual GDP and EUR bn
Sources: Eurostat, Allianz Research.
Head of Insurance, Wealth and Trend Research
arne.holzhausen@allianz.com
Expert, Insurance Markets