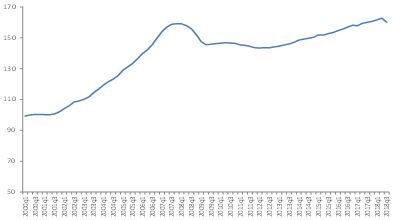
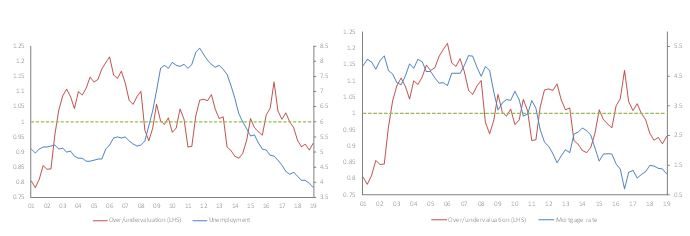
Global housing prices have hit an all-time high, on aggregate 58% above pre-crisis levels. This raises questions as to the risk related to bubbles in the housing sector. In order to gauge such risk, we have developed a simple model using unemployment, disposable income and mortgage rates to determine whether the housing sector in a given country is over- or under-valuated compared to fundamentals. We see mild overvaluation of global house prices in the order of 4% on average globally. We identify three groups of countries:
- Overvalued: Singapore (13%), the U.S. (6%) and Spain (5%). Overvaluation in Singapore is close to historic highs and this therefore implies a risk of correction. In the U.S., overvaluation is much below the historic high of 26% (2006) and so we perceive much lower risk in comparison to that period.
- Fairly valued: Canada, Hong Kong. These markets have corrected recently as result of regulations (Canada) or a challenging economic environment (Hong Kong).
- Undervalued: The UK (7%) Australia (3%), Brazil (6%) and China (15%). The UK has swung into undervaluation post Brexit vote and a significant London slowdown. Meanwhile, the undervaluation in Australia and China are largely a result of policy, such as taxes and regulations.
A long rising streak, record high house prices and key indicators imply risk ahead
House prices have seen an uninterrupted rise since the global financial crisis and now stand 60% above pre-crisis levels, on par with the highs of the global financial crisis on aggregate globally. Notably, average house prices have increased by 58% since the post-crisis trough in the U.S., 60% in Australia, 81% in Canada and 148% in Hong Kong. On average, housing upturns tend to span a seven to ten year period. This suggests that the current housing cycle, now in its eighth year, could be in a late stage.


