Executive Summary
- The Euler Hermes Enabling Digitalization Index (EDI) measures the ability – and agility – of countries to help digital companies thrive and traditional businesses harness the digital dividend. This is the third edition of our ranking (a score from 0 = worst to 100 = best). The score is based on five components: Regulation, Knowledge, Connectivity, Infrastructure and Size.
- In our 2019 ranking of 115 countries, the U.S., Germany and Denmark are the top three “digitagile” ones.
- The best improvements from last year’s ranking are seen in Denmark, which moved up nine ranks, replacing the Netherlands on the podium this year; in China, which rose eight ranks to feature in the top 10 for the first time and in New Zealand, which edged up to 14th place (up from 22nd last year).
- Strategies to enable digitalization differ across countries: We identify three strategies for digitalization that have been used over the past year:
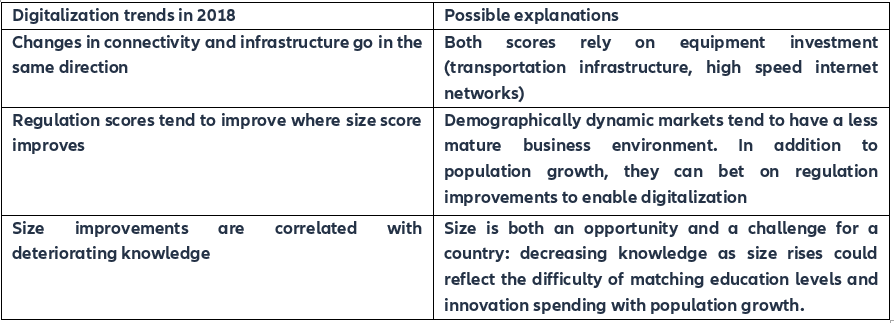
- Emerging Markets (EMs, namely China, India, Turkey, Kenya, Brazil and Morocco) played their cards right. Improving regulation was the preferred channel for digital enablement to accompany an increase in size. This improvement came at a time of financial stress for such markets as the U.S. Federal Reserve was hiking interest rates and drying up global liquidity. This, along with the uncertainty shock created by President Trump’s trade tariffs, can explain EMs’ pressing need to improve their attractiveness to investments to accelerate digitalization.
- Countries that already had a strong regulation score focused on more costly components of the EDI, such as knowledge. This was the case for many advanced economies (Italy, Spain, Germany, Canada, the UK, South Korea and the U.S.).
- Lastly, smaller countries which could not bank on size and already had good regulation and knowledge scores focused on connectivity to provide an appropriate environment for digitalization. This is the case in Denmark, Singapore and Ireland, but also small Eastern Europe and Latin American markets.
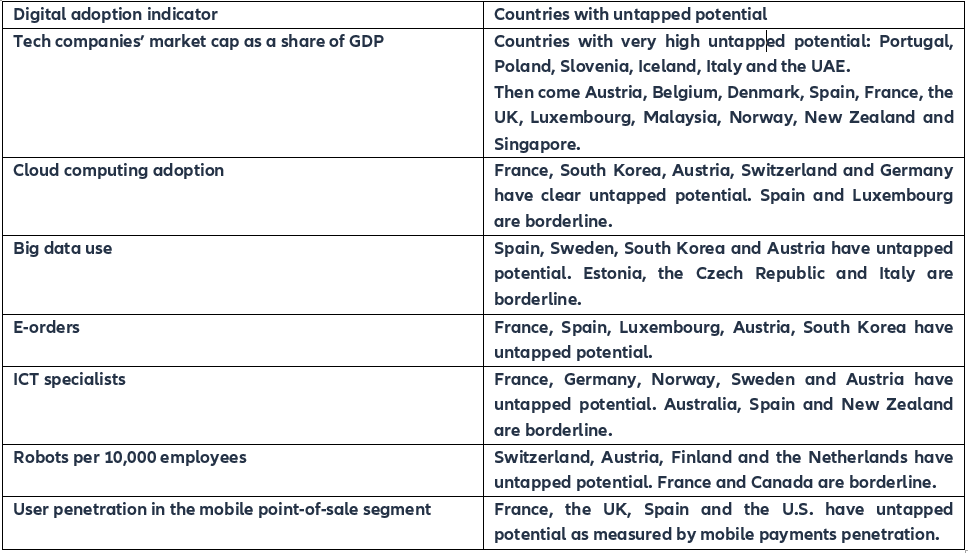
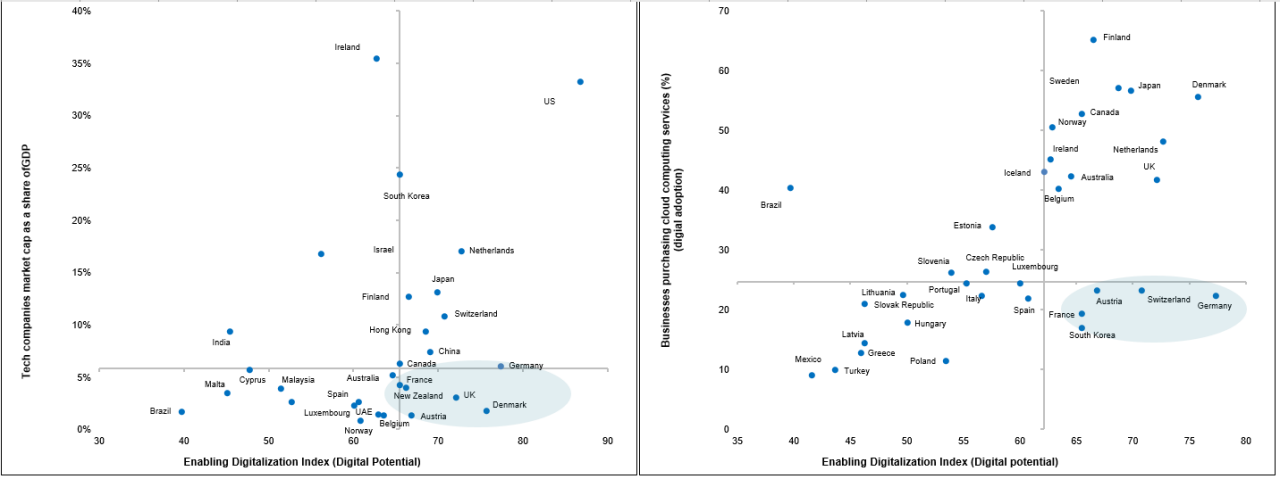
- Where is the untapped potential? We compare our EDI with seven existing digital adoption indicators. We find that several countries have a lower digital adoption than what the EDI score would suggest, including Austria, France, Spain, South Korea, Switzerland, Germany, Luxembourg, New Zealand, Norway, Sweden and the UK. These are countries where the EDI is high, but where existing proxies for digital adoption suggest that companies have not yet fully embraced digitalization.
- The optimal strategy for these countries would be to focus on knowledge: Out of our EDI subcomponents, we identify those that are significantly correlated with digital adoption. In the case of tech market capitalization, cloud computing, big data and e-orders, the knowledge score — comprising skills indicators (higher education and training, digital competences) and data on innovation capabilities (R&D spending, scientific publications) — is the most significantly correlated.
Prepare for the digital war: First, the Chinese breakthrough in our ranking is a wake-up call, and can partly explain the escalation of the trade feud between the U.S. and China into a tech cold war. Merchandise trade disputes are just the tip of the iceberg, and tariff hikes can be reversed. But recent sanctions on Chinese smart device manufacturers and infrastructure providers could herald a structural inward shift in the digitalization process in both the U.S. and China, as well as the “geo-politicization” of the race for the deployment of 5G technology. Our ranking shows which countries will be able to compete in this digital war to become hubs for the development of digital technologies. And comparing our index with existing digital adoption indicators identifies hidden “digital gems” which could provide an appropriate environment for the digitalization of companies but still have untapped potential, and hence lower barriers to entry.
A systemic sector and the rise of new risks: The digital economy now accounts for an increasingly large chunk of the global economy (more than a fifth of global GDP). In the U.S., retail e-commerce rose by +13.7% in 2018 (after +16% in 2017), compared to +4.6% for the overall retail sector (after +4.5% in 2017). In China, online retail increased by +29% (after 39.3% in 2017) compared to +3.8% for the overall retail sector in the same period (after 10.3% in 2017). Global Information and Communication Technologies (ICT) services exports – which include computer, communication and information services – rose to 10.5% of total services exports, up from 6.3% in 2004 and 3.1% in 1995. Yet the universality of the digital sector puts it at risk of a potential confidence crisis. The more a country embraces digitalization, the more it is exposed to new waves of cybercrime, ransomware, hacking of critical infrastructure and vulnerabilities of smart manufacturing. Despite increasing their numbers of secure servers and improving regulation, the best performing countries are de facto more exposed to these new risks.
Creative destruction and insolvencies: Finally, identifying countries with the best progression in the EDI ranking suggests the potential for creative destruction that could take place in the next few years, i.e. the possibility for an accrued number of company insolvencies in sectors that are highly sensitive to technological disruption, such as retail. In France, for instance, a new wave of knowledge-based investment is simultaneously causing business creation (+15% in 2018) and rising insolvencies (+6.6%) in sectors such as agrifood, retail, accommodation & catering, transportation and other services (France: Rise of the Machines, April 2019).
In the headlines: Best performers
The U.S., Germany and Denmark on the podium
The U.S., Germany and Denmark make the top three of the 2019 edition of the EDI[1]. Once again, the U.S. leads by far due to its best in class knowledge ecosystem, competitive market size and favorable regulation. Not only do U.S. companies already benefit from the best conditions for digitalization, but the connectivity quality is still improving, with an exponentially increasing number of secure servers[2]. The only cloud on the horizon is the infrastructure score, which declined from last year. This highlights the need for the U.S. to strengthen its logistic infrastructure and competence.
Germany keeps its second place, with the best knowledge ecosystem (tied with the U.S.) and infrastructure for trade. It saw a marked improvement in both connectivity and knowledge scores. Denmark is the newcomer to the podium, relegating the Netherlands to fourth place. This move can be explained by Denmark’s unique connectivity improvement, coupled with better infrastructure. Indeed, Denmark nearly tripled its number of secure servers (700,000) to a higher number than Brazil or China, and close to that of Russia. At the same time, its infrastructure score improved, thanks to a better timeliness of trade shipments and better technology to track and trace consignments.
China, rising to the top 10
China makes a booming entrance to the top 10 at 9th place, up from 17th place in 2018. The explanation lies in the country’s regulation score, as China made starting a business much easier and shorter (nine days) by removing lengthy procedures; in this, it has reached the level of high-income OECD countries. Other improvements in paying taxes, registering property and protecting minority investors also helped boost the score. Such progress in regulation is in line with China’s ambitions to be a digital leader. The “Made in China 2025” strategy aims at targeted investments in research and development (R&D) and an emphasis on technological innovation. This suggests we should see the country’s knowledge and connectivity scores rise significantly in the next few years. Not to mention that the size of the Chinese market enables companies to scale up their businesses easily and strengthen Chinese “self-dependent” innovation, rather than replicating Silicon Valley companies. In the future, we can also expect China’s regulation score to reflect the proposed progress in intellectual property protection and technology transfer.
Different strategies for digital enablement
In our sample of 115 countries, we identify different digitalization trends in 2018. This allows us to classify country progress into three digital enablement strategies:


