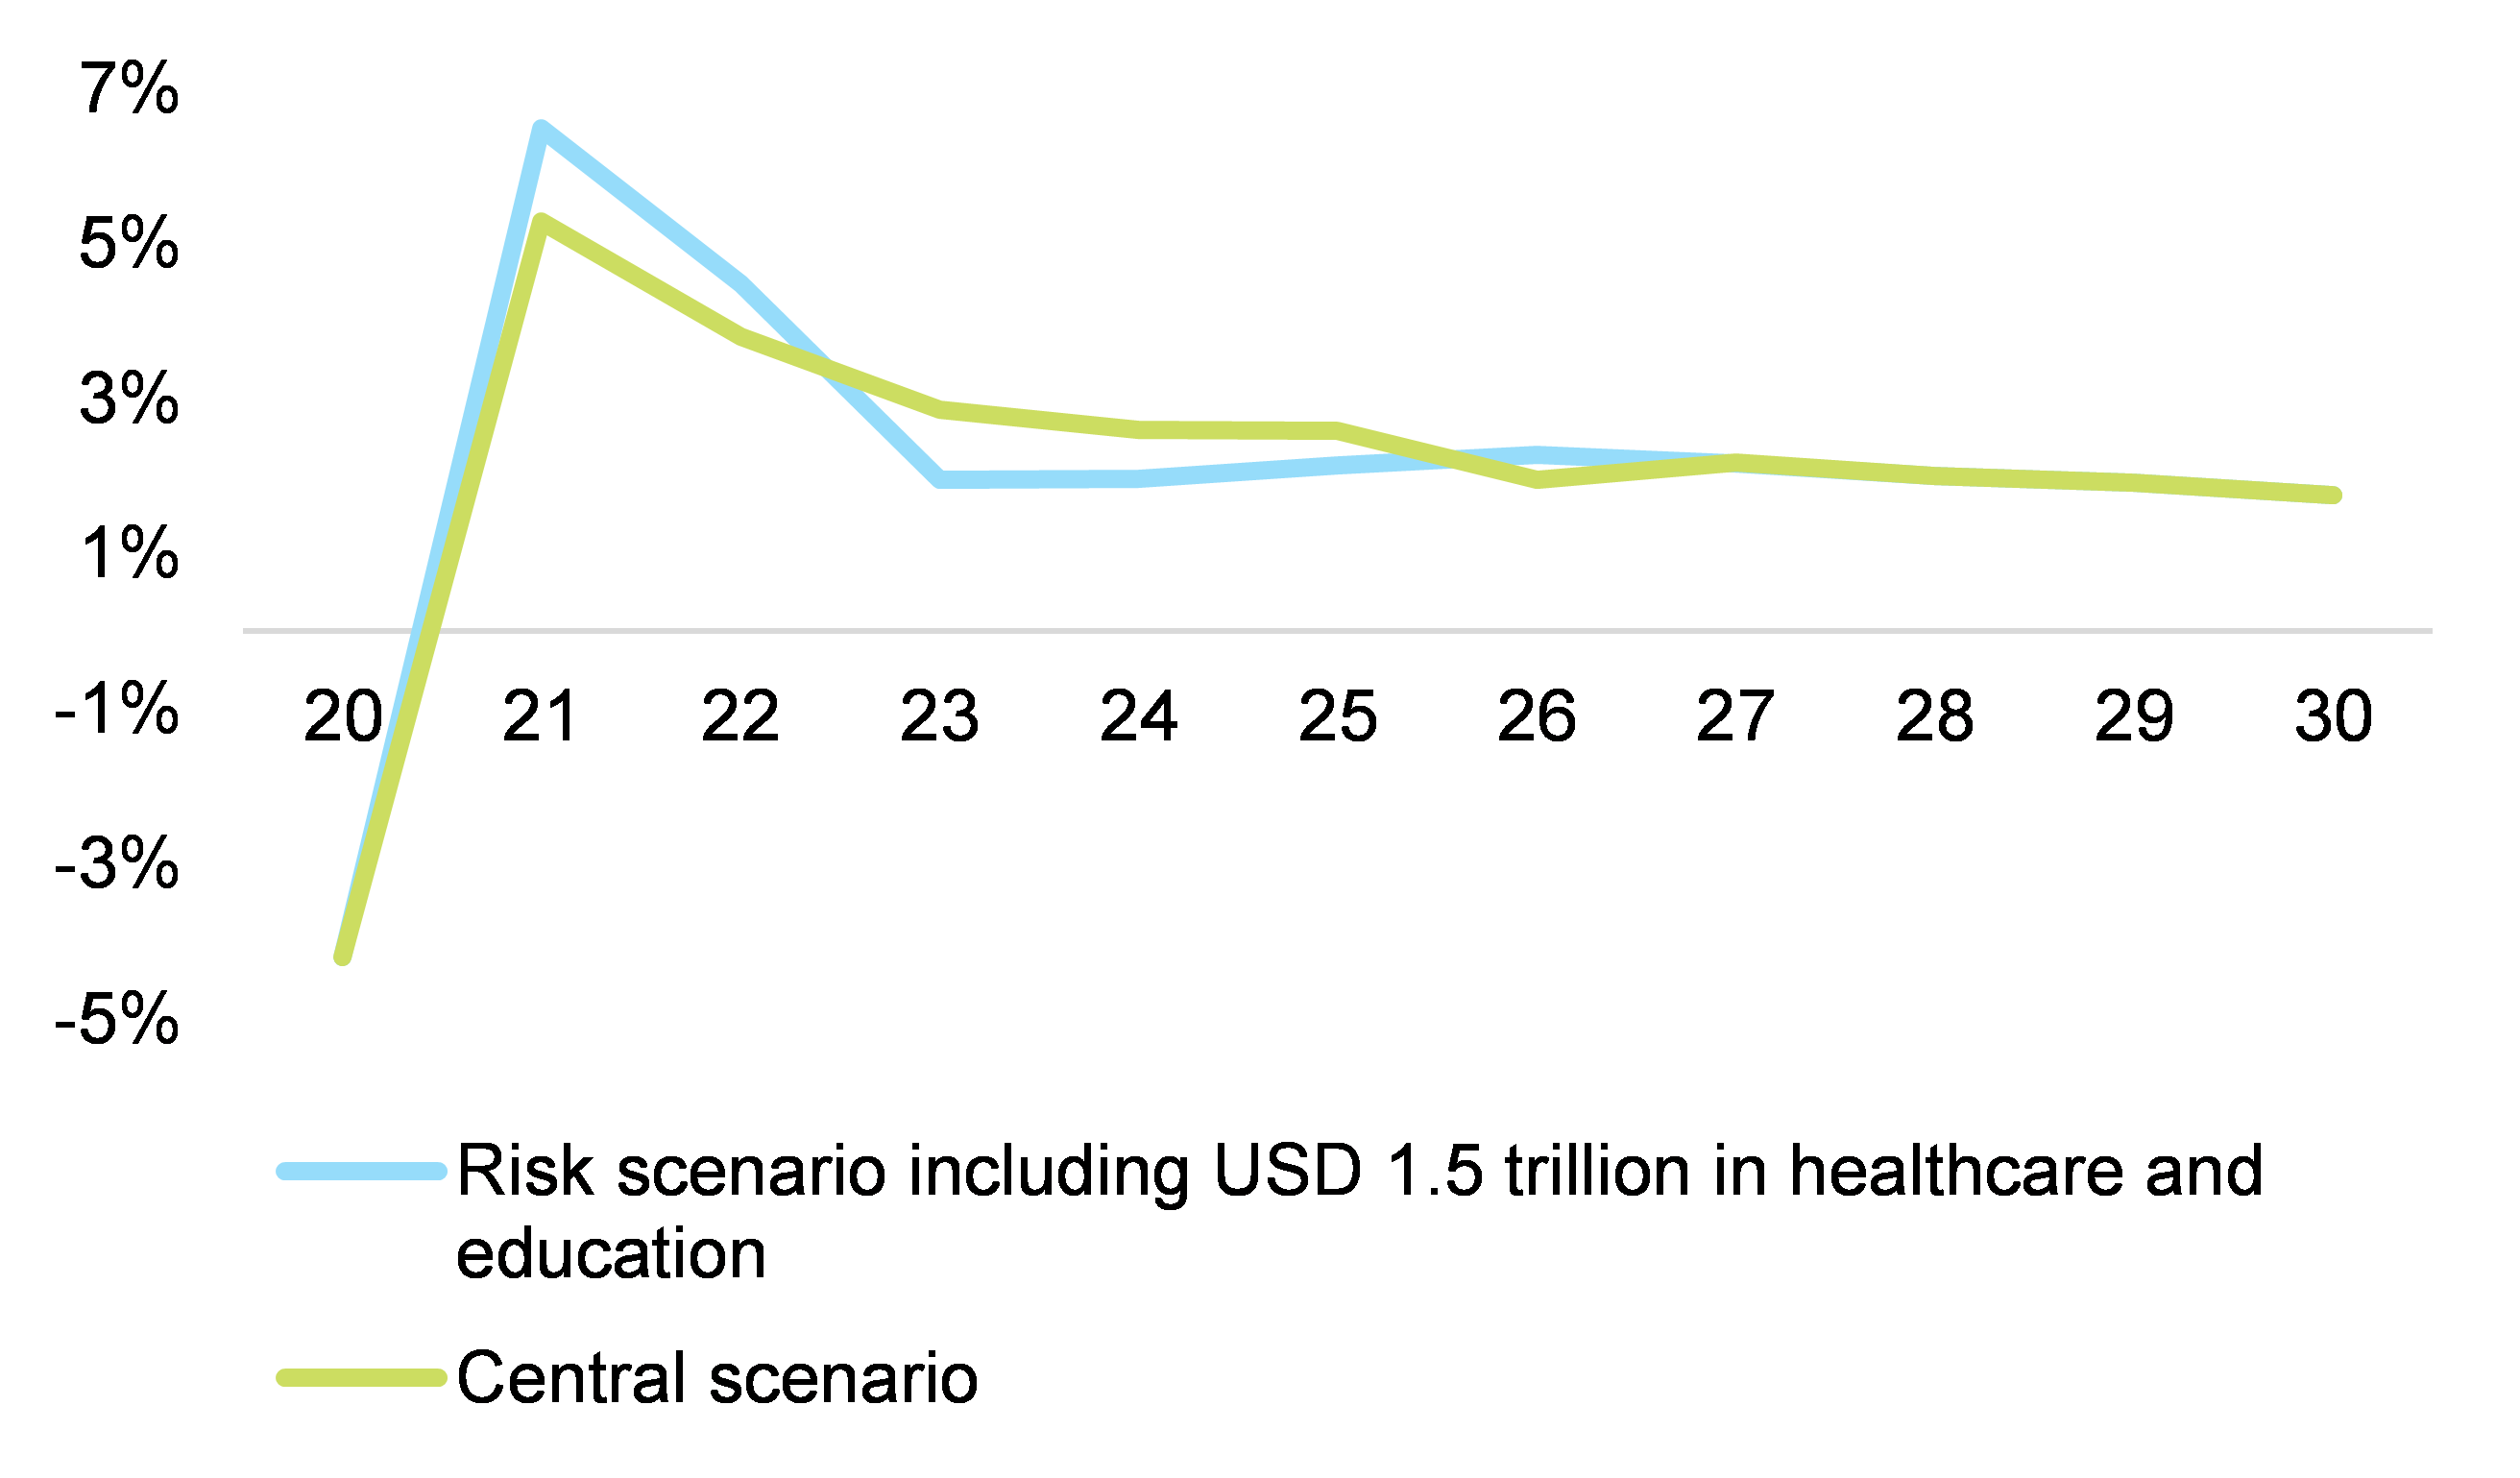
Biden’s USD2.3trn ‘Build Back Better’ infrastructure plan (see annex 1 for details) represents the second stage of a three-phase stimulus rocket and will be a long-term driver of growth in the US. We expect the infrastructure investments to postpone the inexorable decline of the US economy’s growth potential, maintaining it above +1.8% y/y at the horizon of 2030 (vs. around 1.4% y/y without the infrastructure plan). Following the first level of stimulus implemented in 2020 and early 2021 (in total USD5trn between the CARES Act, Covid Relief Package and the American Rescue Plan), we now expect the total supplementary public spending in the US to top USD1.1trn in 2021. As a result, our central scenario forecasts GDP growth of +5.3% y/y in 2021, followed by +3.8% in 2022. However, if Biden manages to pass the third phase of the stimulus rocket (focused on education, childcare and healthcare and estimated at between USD1trn-USD2trn, to be announced in the coming weeks), US GDP growth could reach +6.5% y/y in 2021 and +4.5% y/y in 2022 (see Figure 1). For now, we expect the size of the total stimulus to be constrained by tough negotiations, even with moderate Democrats, over increasing taxes on the wealthiest households and corporates to finance higher public spending. The third phase of Biden’s plan is therefore not included for the moment in our central scenario.
Figure 1 – GDP growth (y/y) impact of Build Back Better program (with and without the USD1.5trn of supplementary spending in healthcare, childcare and education)
In a
recent report, we showed how the US economy’s GDP growth potential is determined by the yearly growth in productivity (positive coefficient), the active population (positive coefficient), the share of imports in total value-added (negative coefficient) and the level of debt as a percentage of GDP (negative coefficient). In order to integrate the impact of a large infrastructure program, we integrate in this equation the share of public investment as a percentage of total public spending (see our estimate in Annex 2) in order to factor in the most durable aspects of public policy and match the innovative aspect of this new infrastructure program. This variable is significant with a positive coefficient. We reiterate our assumptions that Democratic administrations on average correspond to below average performance in terms of productivity growth and above average performance in terms of the growth of active population. In respect of the share of imports in the percentage of total value-added, we assume a progressive increase from 14% in Q4 2020 to 16% at the horizon of 2030. In order to identify different trajectories of growth potential (Figure 2) corresponding to different sizes of infrastructure programs, we compute two different trajectories of the ratio of public investment to total public spending (central case: USD2.3trn of infrastructure spending more than offsetting the US infrastructure gap, and an alternative scenario with USD1trn of infrastructure spending less than offsetting the infrastructure gap). In our central scenario, US GDP growth should be close to +1.8% y/y at the horizon of 2030 compared with our previous scenario, which factored in a lower size of overall fiscal packages.
Figure 2 – Impact on US GDP growth potential of infrastructure programs (in function of size)
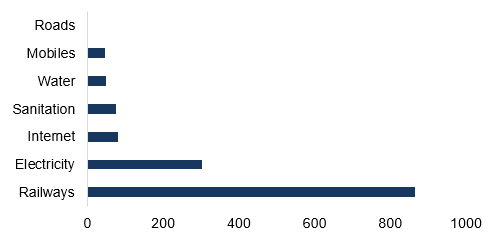
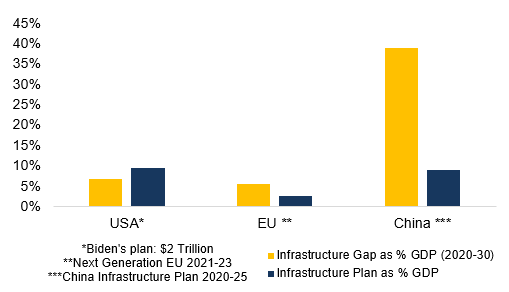
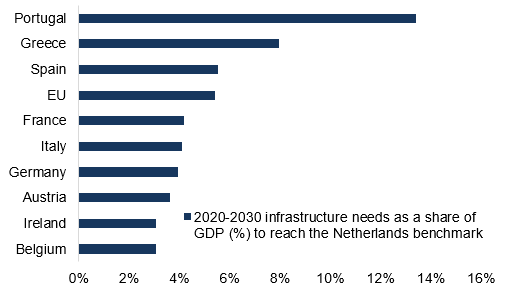
The first leg of the Build Back Better program will more than offset the US infrastructure gap over 2020-2030, which we estimate at 6.8% of 2020 US GDP or USD1.42trn. Our proprietary infrastructure investment need index estimates the infrastructure spending gap over 2020-2030 compared with a benchmark in the Netherlands. Infrastructure investment needs are computed using multiple indicators of railway, electricity, water, sanitary, road, and internet infrastructure quality. For the US, we identify the needs by infrastructure type (Figure 3) at USD395bn for roadway and motorway networks, USD866bn for railways and USD304bn for power grid system. Indeed, the American Society of Civil Engineers (ASCE) has given the nation’s overall infrastructure a C- grade in 2021. US infrastructure investment needs are +1.4pp higher than those of the EU (5.4% of GDP), +2.6pp higher than those of France (4.2% of GDP) and finally +2.9pp higher than those of Germany (3.9% of GDP) (see Figure 5). However, they remain much smaller compared with China’s (38.9% of GDP).
Figure 3 – US infrastructure investment needs over 2020-2030
Figure 4 – US infrastructure investment needs over 2020-2030* (USDbn)
Figure 5 – Infrastructure spending vs estimated gap (% of GDP)
Figure 6 – EU infrastructure investment needs over 2020-2030* (USDbn)
The Build Back Better program has the potential to create 21 million jobs in the US by 2030 but… Our proxy of “durable investment” (public investment to total public spending ratio) is expected to increase from 21% to 24% at the horizon of 2030. A simple correlation analysis suggests that such regime switch has the potential to create 21 million jobs. This estimate is in line with the Georgetown University Center on Education and the Workforce’s own estimate as they identify a potential of 15 million jobs created with a USD1.5trn infrastructure program . During large programs of infrastructure investments, jobs are concentrated in transportation and material moving (see Annex 3) as well as construction and extraction. But such a performance in terms of job creation would require a maximum of private actors’ participation, i.e. a minimum of crowding-out effects.
There is a low likelihood to see crowding-in effects (a +1% increase in government investment leads to a +0.5% increase of private non-residential investment) outweigh crowding-out effects (a +1% rise of government consumption spending triggers a -2.4% decline of private investment). Phases of large fiscal stimuli generally produce ambiguous effects on private investment. In order to disentangle crowding-in and crowding-out effects, we estimate an investment function (annex 4) connecting non-residential investment (in yearly variation) to the government’s consumption expenditures, public investment, profits (with a one-year lag) and taxes expressed as a percentage of profits (negative coefficient). In this equation, crowding-out and crowding-in effects are well separated: public consumption expenditures negatively impact private non-residential investment as a +1% increase of the former reduces by -2.4% the latter (in line with Ricardian equivalence, private investors reduce their spending when anticipating higher future tax rates); on the other hand, government investment (including infrastructure spending) has a positive effect as a +1% increase of public investment increases by +0.5% private investment. Over the last five years, government consumption expenditures on average increased by +1.3% y/y, while public investment grew by +3.2% y/y. This means that public action over the last five years rather contributed negatively to growth of private investment. A rebalancing toward public investment (long-term spending) and a stabilization of short-term spending are required in order to initiate a new virtuous and long-lasting investment cycle. The probable rise of the tax rate will also be a clear limit when aiming at higher job creation at the horizon of 2030.


