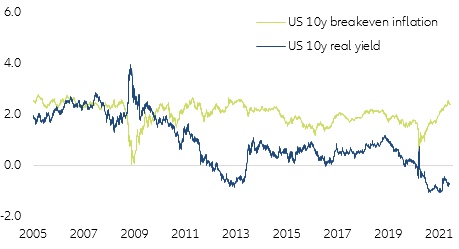
After reflation, stagflation? While in the real economy the “Grand Reopening” party has just started, bond markets are seemingly positioned for a prolonged stagflationary scenario. Headline CPI reached 5% y/y in May but yields retreated. Even at a long-term horizon, a substantial inflation discount seems to be priced in, with 10y breakeven inflation at 2.4%. At the same time, the real yield remains deeply negative at -0.9%, suggesting a subdued long-term economic outlook (Figure 1). Market expectations seem to be skeptical about the Fed’s recovery narrative. It seems that we are once again witnessing a battle of expectations between markets and the Fed. This usually creates an unstable equilibrium prone to adrupt adjustments. But what if expectations do not diverge at all and other factors are behind this situation?
Figure 1 - Are markets positioned for a stagflationary scenario?
Sources: Refinitiv, Allianz Research
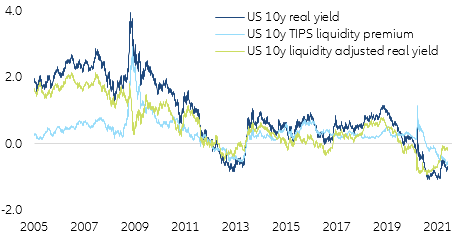
Repeat after me: Breakeven inflation is not expected long-term inflation. To answer the question adequately, one must avoid the conventional decomposition of the nominal yield into breakeven inflation and real yield. Both components do not express clean expectations. Being derived from traded securities, they also include a price for risk (risk premium) and trading (liquidity premium). The more uncertain the market environment, the less reliable they are as a proxy for expectations of the real equilibrium rate or long-term inflation. The current situation is a case in point. Let’s define the liquidity premium as the compensation investors demand for holding a less liquid bond than a normal fixed-rate US Treasury. Normally the premium is positive, but it can turn negative if there is overshooting demand. Instead of receiving the premium, investors then pay a premium to hold the desired bond. This is exactly what we are currently observing. Market conditions for inflation-protected US Treasuries (TIPS) have become very tight as investors have massively jumped on the reflation trade (i.e. record inflows for TIPS ETFs) while Fed purchases were still reducing available supply. If we adjust the real yield for the distorting liquidity effect by subtracting the liquidity premium, we see that it has already returned to the pre-crisis level. So the recovery is already priced in, the signal is just blurred (Figure 2).
Figure 2 - Real yields are highly distorted by tight market conditions
Sources: Refinitiv, Allianz Research based on D'Amico, Kim & Wei (2018)
Risk component versus expectation component
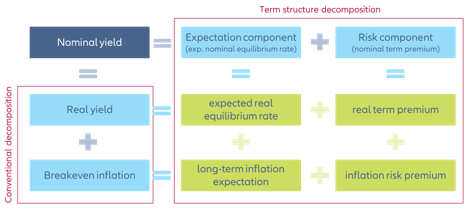
To extract long-term expectations from the yield curve one should use more reliable methods. We propose using term structure models. These decompose nominal yields into a pure expectation component (or expected nominal equilibrium rate) and a risk component (or nominal term premium) (Figure 3).
Figure 3 – Decomposing nominal yields
The expectation component combines the expected real equilibrium rate and the long-term inflation expectation. The risk component (or nominal term premium) is thought of as the excess return investors demand for the risk of holding a long-term security rather than investing continuously in short-term rates. The risk component itself combines the premium for inflation risk (inflation risk premium) and real interest rate risk (real term premium) (Figure 3). The inflation risk premium compensates investors for the risk that inflation will be higher or lower than the current long-term expectation. The real term premium can be thought of as the deviation risk of the real equilibrium interest rate. However, the risk component as a whole can also be altered by imbalances in the supply and demand of duration. It is thus the component of nominal yields which is most affected by the central bank's bond purchases (Quantitative Easing or QE) as these usually aim at extracting duration from the market.
Expectations remain anchored – the music is playing elsewhere
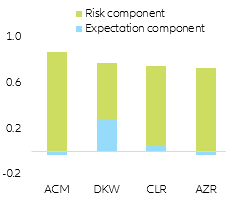
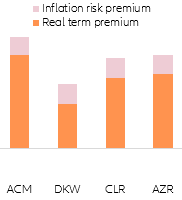
Dealing with variables not directly observable in markets, term structure models differ in design and outcome. To strengthen the robustness of our analysis we therefore use four different models: ACM (Adrian, Crump & Moench, 2013), DKW (D'Amico, Kim & Wei, 2018), CLR (Christensen, Lopez & Rudebusch, 2010) and AZR (our proprietary Allianz Research model). This analysis reveals that the YTD increase of US 10y nominal yields is almost entirely due to the risk component (nominal term premium) not the expectation component (Figure 4). So investors price heightened uncertainty about the post-Covid-19 economic and monetary equilibrium, but haven’t adjusted their long-term expectations, at least so far.
Figure 4 – US 10y breakdown of YTD increase of nominal yield
Sources: Refinitiv, Allianz Research
Figure 5 – US 10y breakdown of YTD increase of risk component
Sources: Refinitiv, Allianz Research
Currently, only one model (DKW) indicates a moderate rise in the expectation component. As long as the expectation component of the majority of the models remains stable, one should be cautious with adjusting the long-term view on US yields. Yield increases solely based on the risk component are usually not sustainable. If we take the analysis one step further, we can see that the rise of the risk component is also not due to a higher inflation risk premium, but explained primarily by the real term premium (Figure 5). Since the beginning of the year, investors have not become more concerned about future inflation but more uncertain in predicting the real equilibrium rate. This means that after a first phase, at the end of last year, where US yield movements were driven by the inflation risk premium, we are now in a second phase of US yield repricing, driven by concerns for the post-Covid-19 monetary equilibrium. This also explains why focusing on inflation numbers was not effective in explaining the latest movements of US yields. The music is just playing elsewhere.
US long-term yields with limited upside in the months to come. The key insights from our term structure analysis are: expectations for the real equilibrium rate and inflation remain firmly anchored so far, though a risk buffer has been built up, in particular with regard to the real equilibrium rate. Based on these findings, what can we expect for long-term US yields by the end of the year and beyond?
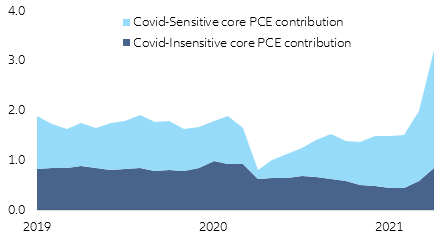
Let's start with the expectation component. Long-term inflation expectations should remain sticky. They are built on underlying trends and should filter out the current noise. The inverted inflation curve also shows that the current momentum is still expected to fade out. A decomposition of the core inflation rate (core PCE) shows that current price pressures predominantly arise from Covid-sensitive components. These effects should not prevail in the long run (Figure 6).
Figure 6 – Current price pressure explained by Covid-sensitive components (contrbution to y/y change of core PCE, in %)
Sources: Refinitiv, Allianz Research based on Shapiro (2020)
A lasting upwards shift of long-term inflation expectations would require a prolonged overshooting of realized core inflation (at least another six months) above 3%. For this to happen, other drivers (especially wages) would have to take over after the fading away of base effects in the summer in order to continue the momentum. We do not see this yet.
As to the expectations of the real equilibrium rate, they should only rise sustainably if the Fed surprises with a perspective of faster and stronger rate hikes. We think this is very unlikely in the 12 months to come. So even if the Fed lifts its key rate outlook from zero hikes through 2023 to one, the impact on yields should be small, given the fact that a risk buffer has been built-up relative to the real equilibrium rate. All in all, there is little upside for the expectation component in the coming months.
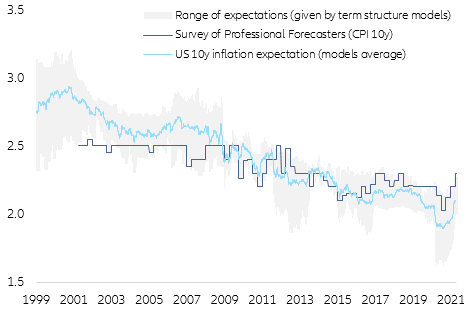
But could the risk component cause another rally in long-term US yields? To assess the range in which the risk component could evolve in the coming months, we study the range of estimates for long-term inflation and the real equilibrium rate given by the term structure models. The estimation range for long-term inflation expectations (as proxy for the inflation risk premium) is now at 27bp around a central value (average) of 2.1%, merely back to the pre-crisis level. However, the range has contracted 40bp since the beginning of the year. The upper bound now coincides with the long-term expectation given by the Survey of Professional Forecasters (SPF). We see the gap of 15bp between the central value and upper bound as the upside potential for the inflation risk premium in the coming months (Figure 7). We could see a new round of inflation risk if the "transitory" narrative is challenged after base effects fade in the summer. Even then, the magnitude should not exceed that seen at the end of last year, when the estimate range was 60bp. It is interesting to see that the quantitative estimate of the models is much closer together than the surveys among analysts, where we see a range over 200bp by the end of the year. Even in 2023 the range is still 80bp.
Figure 7 – Inflation expectations have just recovered to pre-crisis levels
Sources: Refinitiv, Allianz Research
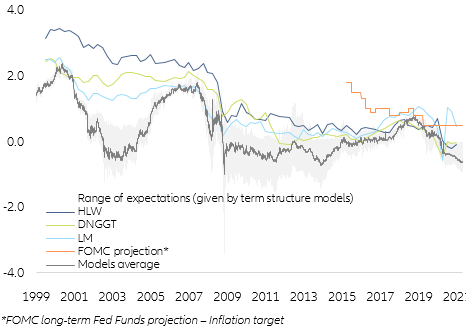
The estimation range for the expected real equilibrium rate (as a proxy for the real term premium) is currently at 90bp around a central value of -0.6%. This range size is in line with the historical average and indicates no major monetary policy uncertainty. The range has widened by 20bp since the beginning of the year. The average stands at -0.6%, which corresponds to a cyclical low. This is well below the estimates from macro-based models such as DNGGT (Del Negro, Giannone, Giannoni & Tambalotti, 2017), HLW (Holston, Laubach & Williams, 2017) and (Lubik & Matthes, 2015). These models set the real equilibrium rate between -0.03% and +0.50%. Their estimates are structurally higher, though. Both estimation methods only converge when the output gap is largely positive. Currently, we still estimate the US output gap at -1.4%. In the medium term, we see the trend of the real term premium pointing upwards as the recovery progresses and the output gap closes. But for 2021, given the sharp rise since the beginning of the year, the upside potential of the real term premium seems largely exhausted (Figure 8).
Figure 8 – Real equilibrium rate : macro models vs term structure models
Sources: Refinitiv, Allianz Research
And if it was all about QE tapering? These results remain puzzling, though. Given the average model dispersion and moderate widening of estimate ranges, we can only explain 25% of the YTD increase in the risk component in this way. A hidden factor seems to exert a significant influence on the risk component. Our assumption is that it is the repricing of QE. To test this, we augment one term structure model (ACM) by a factor for the supply-demand balance of long-term Treasury securities. This gives us a sensitivity of the risk component to QE (around 4bp per 1% central bank holdings).
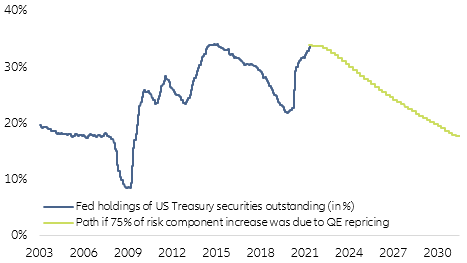
Figure 9 – Markets pricing an aggressive tapering path
Sources: Refinitiv, Allianz Research
If we attribute the unexplained 75% of the risk component increase to a repricing of QE, this sensitivity implies a return of Fed holdings to pre-crisis levels within seven years (Figure 9). This is a highly ambitious outlook compared with the tapering path after the Great Financial Crisis. It would take a huge hawkish push by the Fed for markets to price an even more aggressive scenario. We consider this to be unlikely to occur, at least in the months to come, confirming our view of limited upside for long-term US yields until the year’s end. The results of our term structure analysis are in line with our traditional fair value model that shows a less than 15% probability for the US 10y yield to exceed 2% at the end of the year and where the risk profile is skewed more to the downside (Figure 10). All this supports our expectation that US 10y yields will remain largely unchanged at year-end.
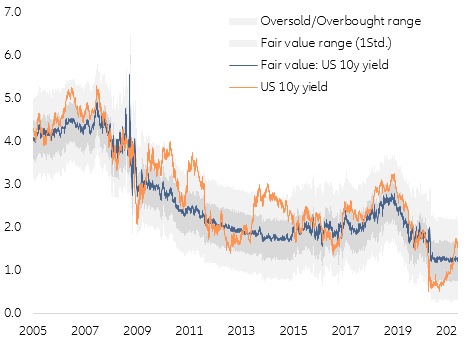
Figure 10 – Limited upside for US 10y until year end, risk to the downside
Sources: Refinitiv, Allianz Research
Author

Senior Economist