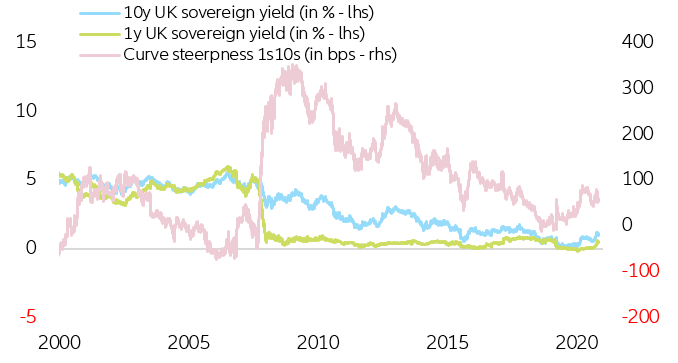
The Bank of England seems caught between a rock and a hard place as the UK faces both elevated inflation — likely to last until Q4 2022 — and upcoming fiscal consolidation. However, by not acting, it risks creating even more inflation. At its monetary policy meeting on 04 November, we expect the Bank of England to significantly cut its growth forecasts as the UK’s economic slowdown intensifies amid supply-chain disruptions driven by global trends and exacerbated by Brexit. We expect +0.6% q/q in Q4 2021 and +1.0% q/q on average in 2022. In theory, this should buy more time before the first rate hike, initially expected in early 2022. However, recent communications from Governor Andrew Bailey have pushed the BoE into a corner: his unexpected hawkish twist triggered an immediate market repositioning, with participants now anticipating a much earlier start of the hiking cycle. The change in tone led to a rapid yield curve bear flattening (short-end of the yield curve rising faster than the long-end), hinting at a deteriorating economic outlook (see Figure 1).
Figure 1 – UK sovereign rates and yield curve steepness
Sources: Refinitiv, Euler Hermes, Allianz Research
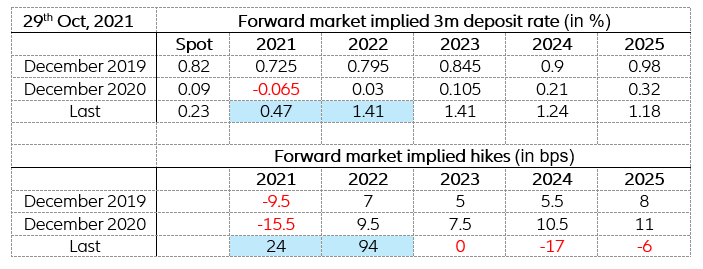
Money market forwards are currently positioned for a ~25bps hike by year-end, followed by an additional ~45bps in Q1 2022, finishing 2022 with an extra ~45bps. Cumulatively, markets expect an ~115bps aggregate hike until the end of 2022 from current levels (0.1%). This would translate into a BoE rate close to 1.25-1.40% (Table 1).
Table 1 – UK sovereign rates and yield curve steepness
Sources: Refinitiv, Euler Hermes, Allianz Research
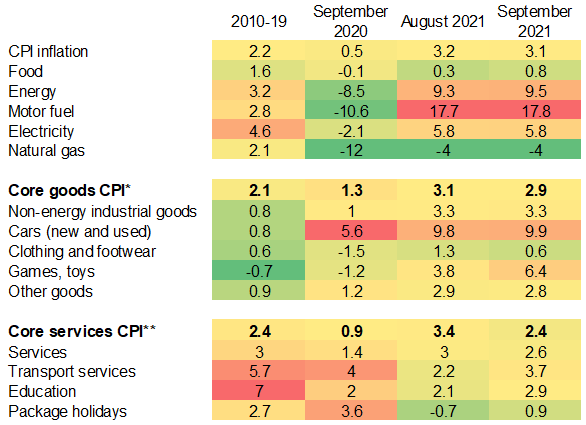
However, embarking on an earlier monetary policy tightening cycle is premature. The UK’s labor market is far from full employment and two thirds of the ongoing surge in inflation is driven by temporary factors such as supply-chain disruptions, Covid-19 base effects, the sharp rise in energy prices, the rise in taxes and the rise in wages, given the mismatch between available jobs and workers. In our view, inflation should reach 2.4% y/y in Q4 2022 from a peak of above 4.0% in Q4 2021 and H1 2022. In fact, core services inflation, a measure that the Bank of England follows very closely, has already decreased to +2.4% y/y in September 2021 (see Figure 2).
Figure 2 – Inflation for key goods and services components, y/y
Sources: various, Datastream, Euler Hermes, Allianz Research
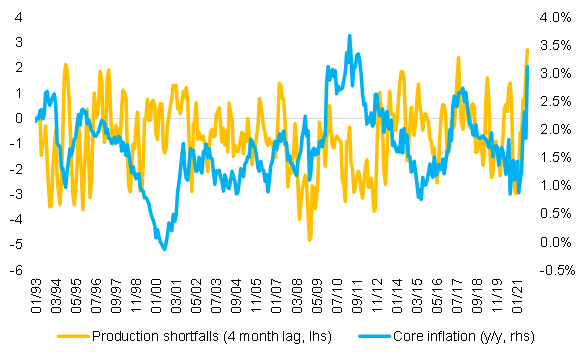
The ongoing surge in inflation is largely explained by global supply-chain disruptions and exacerbated by Brexit. We find that the supply-demand mismatch measured by the production shortfall in the manufacturing sector (the difference between new orders and output) is an explanatory factor for core inflation with a lag of four months (see Figure 3). Hence, in August, the production shortfall of May suggests that the inflation due to the supply-demand mismatch stood at +2.3% y/y out of the 3.1% total increase in core inflation. Looking forward, the supply-demand mismatch inflation should reduce to 1.7% y/y in December but remain elevated going forward. Globally, supply-chain disruptions should remain elevated into 2022 and not fully normalize before 2023 . At the same time, Brexit remains a significant hurdle for more than half of UK importers and exporters. As of October, 60% of importing businesses continue to state that they have faced challenges importing, notably additional paperwork and transportation costs. To add to this, border controls for UK importers have been delayed to 2022. Overall, we expect a contribution of more than +1pp to headline inflation from supply-chain disruptions in 2022.
In addition, while average earnings growth should slow to 3.5% y/y in 2022 from 5.1% in 2021, Brexit will keep it above 3% beyond 2022. There is clearly a mismatch between demand and supply in the labor market: In August, job vacancies reached a record high (1.1mn persons or 3% of the workforce) and weekly average earnings increased by +7.2% three-month y/y (+4.8% on average excl. Covid-19 and furlough scheme effects). At the same time, there were still 1.1mn people under the furlough scheme. The mismatch could mean that more than 220K are at risk of entering in unemployment as of Q4 since the furlough scheme expired at the end of September. This would mean that the unemployment rate could rise to 5.1% from 4.5% currently – still 0.8pp above pre-crisis levels (and to slow to 4.7% in 2022).
While this should somewhat ease wage pressures in the coming quarters, the problem is that workers on furlough are not suitable for those jobs where demand is high. In addition, there are more inactive people following the Covid-19 crisis who might return to the labor market. And as of mid-2021, incoming foreign workers were still 7% fewer compared to June 2019 (i.e. c.172K work-related visas granted in the year ending June 2021). Wage growth has been above 3% since 2018, a sign that the labor market supply-demand mismatch could last in the absence of a sizeable immigration policy.
Figure 3 – Core inflation vs production shortfalls (new orders – output)
Sources: ONS, IHS Markit, Euler Hermes, Allianz Research
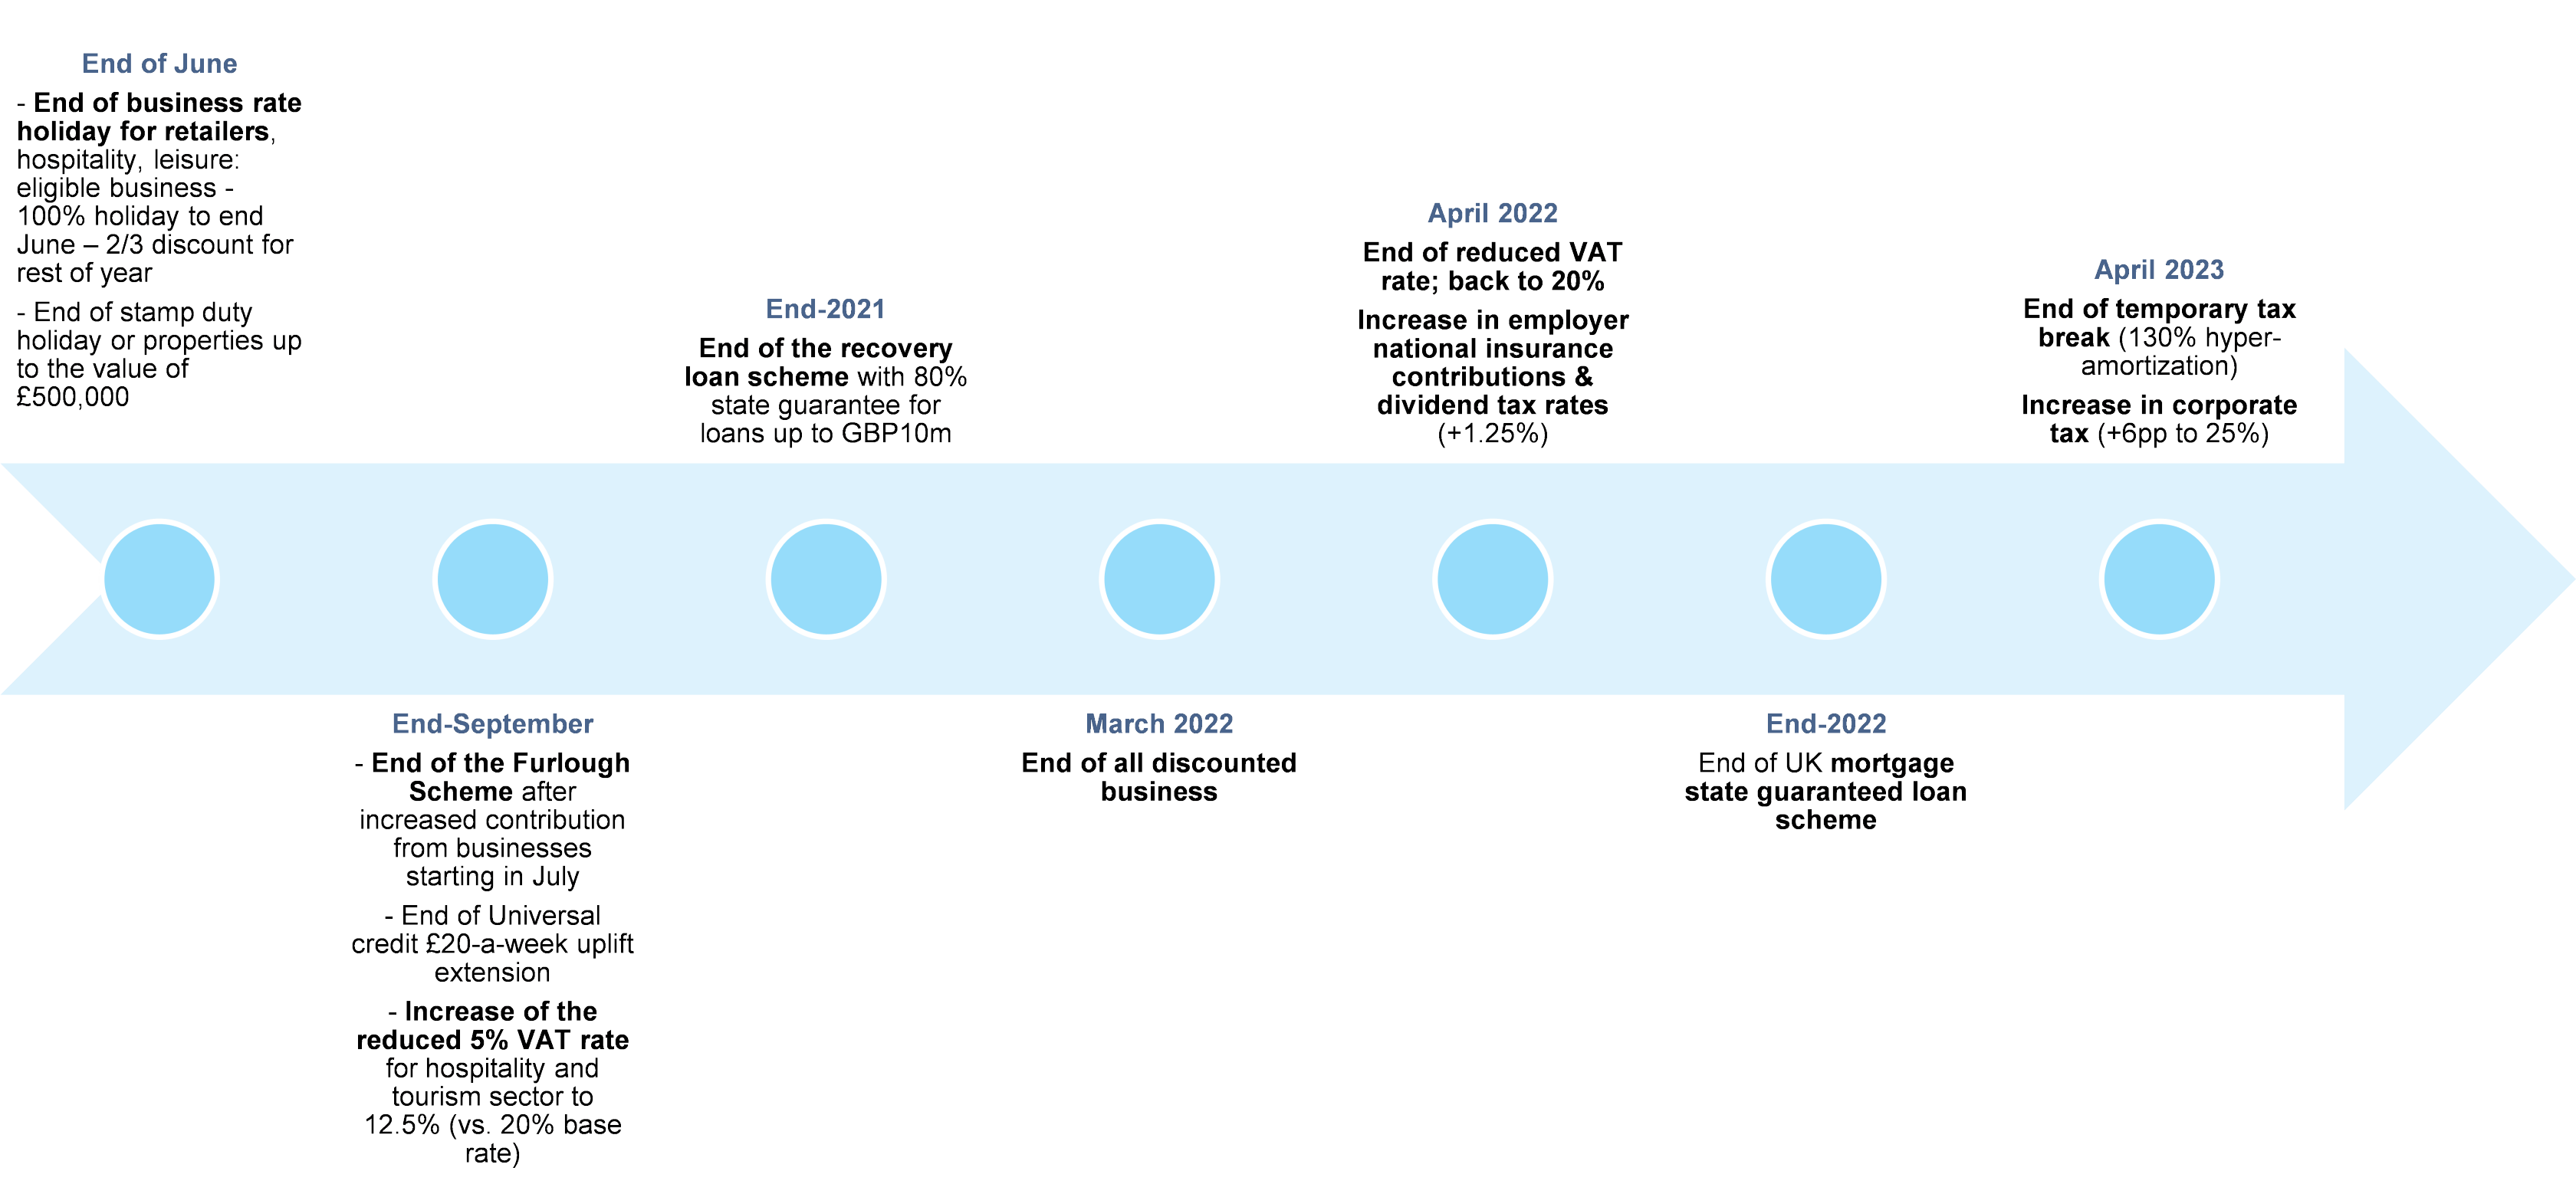
In this context, embarking on an earlier tightening cycle could raise the risks of a 'technical' recession, especially as the UK will be the first major economy to start fiscal consolidation in 2022. Even as other G7 countries are implementing significant amounts of fiscal stimulus, 2022 will bring about the freeze of personal tax allowances and thresholds for households in the UK. This will be followed by an increase in the headline tax rate from 19% to 25% for corporates with profits of GBP250,000 or greater (around 10% of firms) in 2023 (Figure 4), bringing the headline corporate tax rate slightly above the advanced economy average. Overall, the tax rises announced in the 2021 Budget increase the tax burden from 34% to 35% of GDP in 2025-26, its highest level since the late 1960s.
Figure 4 – Planned end-dates for state support in the UK following Covid-19 crisis
Sources: UK government, Euler Hermes, Allianz Research
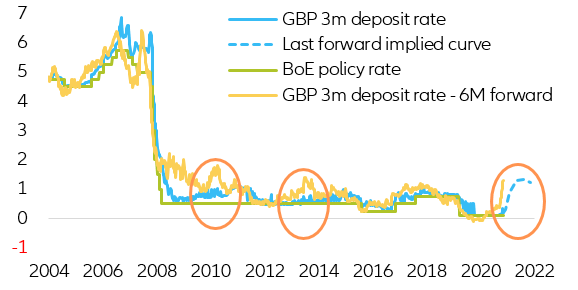
The BoE could decide to remain in wait-and-see mode to avoid tightening financing conditions too early. However, given the current market expectations, the probable sterling depreciation of up to -8% in such a scenario, could eventually create even more inflation, entering into a self-fulfilling feedback loop. It is important to remember that markets are not always right, and this certainly is not the first time in history that markets front run an early monetary policy move, but central banks do not deliver. This is exactly what happened back in 2011 and 2014, when money market futures were discounting the beginning of a new hiking cycle but the BoE did not react. However, the current hawkish market positioning is more aggressive than that seen in 2011 and 2014, portraying a stronger market conviction in an early hiking wave (Figure 5).
Figure 5 – Money market futures and BoE rate (in %)
Sources: Refinitiv, Euler Hermes, Allianz Research
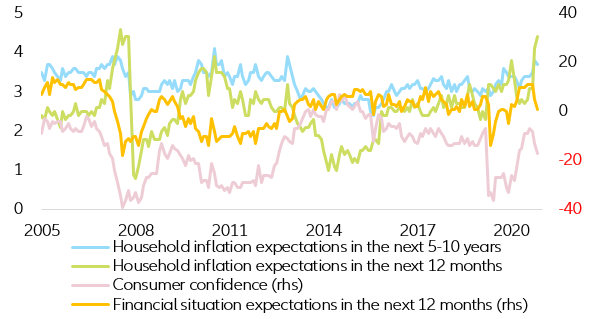
In sync with markets, households are increasingly adding pressure on the BoE by raising their short- and medium-term inflation expectations and indicating a worse-than-expected future economic outlook (Figure 6).
Figure 6 – GfK consumer confidence indicators in the UK vs inflation expectations (YouGov/Citi Group)
Sources: Refinitiv, Euler Hermes, Allianz Research
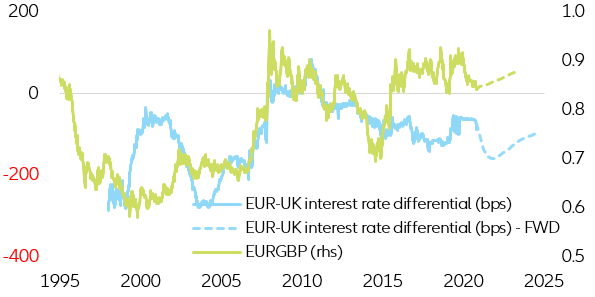
The latest money market rebalancing has led to a mild appreciation of the GBP vs the EUR, reflecting the increased short-term interest rate differential in favor of the GBP. At the same time, the long-end of the EURGBP forward curve timidly repositioned, aggravating the mid- to long-run expected depreciation of the GBP and reflecting the beginning of the ECB’s hiking cycle and the worse-than-expected UK economic outlook (see Figure 7).
Given the current market expectations, should the BoE not act, the sterling depreciation of up to -8% could eventually create even more inflation, entering into a self-fulfilling feedback loop. Several reports show that the FX pass-through to import prices is one of the highest in the UK, given its dependency on foreign inputs (around 55% of UK import prices are estimated to reflect changes in FX, compared to 10% in Germany and 5% in France ). The import share is highest for manufacturing goods, notably food, clothing and transport. Overall, 29% of UK consumer expenditure is dependent on imports. Research shows that between June 2016 and June 2018, the impact of the -10% depreciation in the sterling boosted inflation by +2.9pp .
Figure 7 – EURGBP and interest rate differential (in bps and EUR per GBP)
Sources: Refinitiv, Euler Hermes, Allianz Research
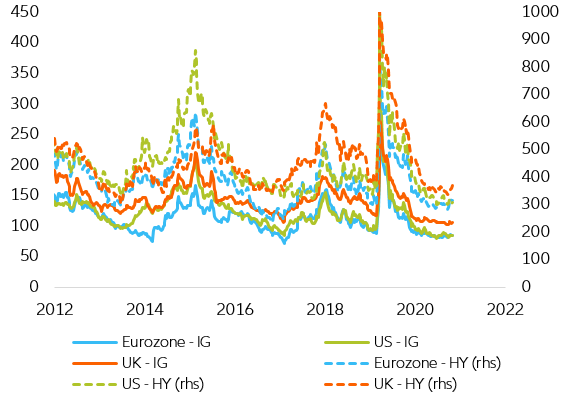
Watch out for wider corporate credit spreads in an environment where business insolvencies are already on the rise. Corporate credit spreads have started to price in the current changing economic environment and some further spread-widening periods are to be expected as they are extremely tight. The additional volatility and uncertainty triggered by the recent money market repositioning has led to a timid widening of investment grade and high-yield corporate spreads. Despite being extremely muted, the small widening could hint at an early corporate-spread dynamics divergence from both the Eurozone and the US (see Figure 8).
Figure 8 – Investment grade (IG) and high-yield (HY) corporate spreads (in bps)
Sources: Bloomberg, BofA, Refinitiv, Euler Hermes, Allianz Research
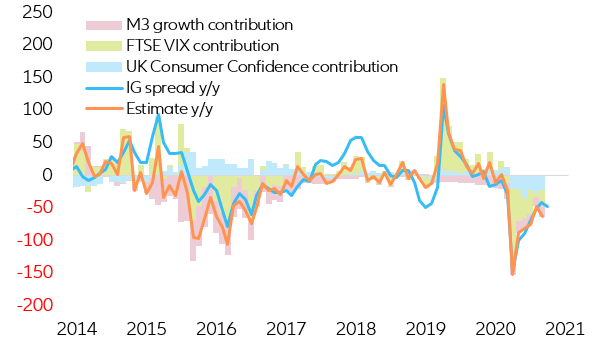
In this uncertain environment, digging deeper into the drivers of UK corporate spreads reveals that the latest spread compression, especially within the investment grade universe, has been led by a combination of declining equity volatility, an improving macroeconomic outlook (proxied by consumer confidence) and expanding policy support (proxied by the M3 money growth in this model). Taking these market drivers into account, a worse-than-expected economic outlook paired with retracting policy support is the perfect mix for a substantial widening of corporate spreads, which could at the same time trigger a spike in equity volatility. Because of this unstable equilibrium and market fragility, a mild widening of credit spreads is to be expected in the short run, especially within high-yield space (see Figure 9).
This new conundrum sets the pace for a possible 10 to 20bps and 50bps widening in investment grade and high-yield corporate spreads from current levels, respectively. However, should the current unstable equilibrium turn south and trigger a wave of insolvencies and defaults, credit markets could experience much wider widening by ~50bps and ~100-150bps for IG (Investment Grade) and HY credit, respectively.
Figure 9 – UK IG corporate spread decomposition (y/y change - bps)
Sources: BofA, Refinitiv, Euler Hermes, Allianz Research
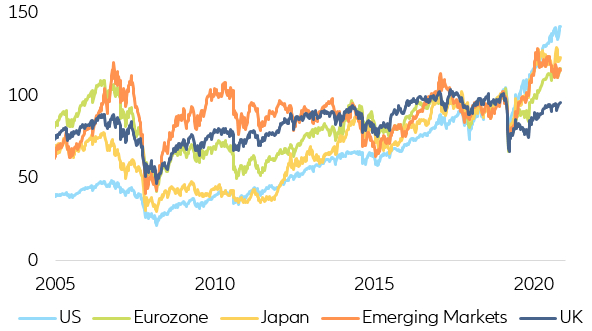
On the equity side, the UK remains the big 2021 underperformer compared to the rest of the world. The recurrent economic uncertainty in the UK has prevented the equity market from joining in the worldwide frothiness, leading the main British index to underperform its international peers. As of today, the large cap FTSE100 index is still falling short of pre-Covid-19 levels (-5% vs Dec 2019). Because of this, it can be argued that at least part of the slower recovery and deteriorating economic outlook has, partially, been discounted, with market participants refraining from going full gas on GBP equity risk. (Figure 10).
Figure 10 - Global equity market performance (100 = Dec 2019)
Sources: Refinitiv, Euler Hermes, Allianz Research
Looking under the surface, it is revealing that the FTSE 250 (Mid cap) has continued to outperform the FTSE 100 (Large cap) since the Covid-19 market sell-off, posting decent 2020-2021 (~5%) performance and leading to a ~15% cumulative excess return vs the FTSE 100 since January 2020. However, despite the mid-cap outperformance, the latest equity market volatility has hinted at the beginning of a paradigm shift in which large caps (FTSE 100) seem to be in a better position, both in terms of valuations, interest rate sensitivity and currency spillover effects, than their mid-cap peers.
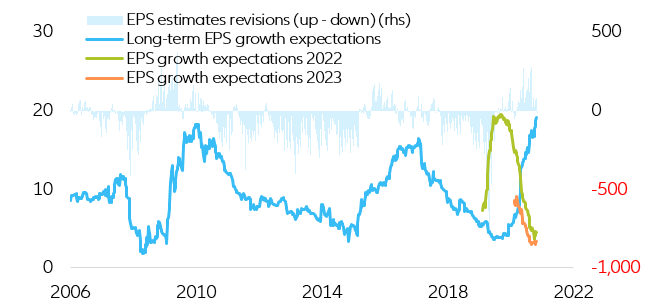
Along these lines and contrary to the FTSE 250, the current EPS growth estimates for the FTSE 100 have already reverted on most of the initial market euphoria for 2022 and 2023, with earnings estimates being revised down since July-August 2021. These indicate that the initial conditions for the FTSE 100 are more favorable in terms of valuations (see Figure 11).
Figure 11 - EPS growth consensus FTSE 100 (in y/y%)
Sources: IBES, Refinitiv, Euler Hermes, Allianz Research
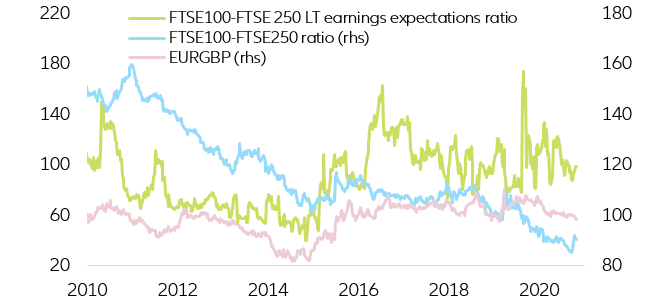
At the same time, the FTSE 100 seems to be negatively correlated with currency movements, signaling that, structurally, it is a relatively good performer in both currency depreciation and increasing long-term yield periods due to its underlying sector composition (high allocation to financials and energy) and exacerbated international exposure (industrials and materials, See Appendix and Figure 12).
Figure 12 - FTSE 100 vs FTSE 250 (100 = Dec 2019)
Sources: IBES, Refinitiv, Euler Hermes, Allianz Research
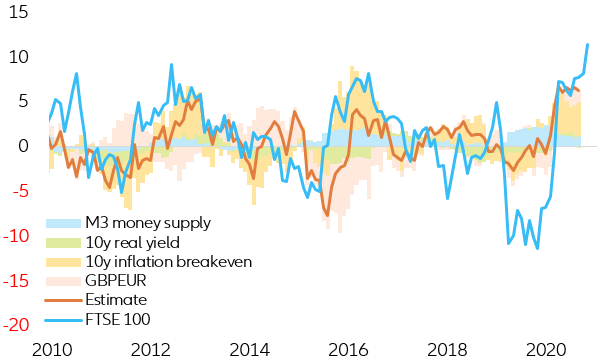
Despite the somehow resilient equity outlook, it is important to bear in mind that the current equity situation is far from stable. As in the case of corporate spreads, the combination of high inflation, policy support and a mildly stronger currency are keeping equities afloat (see Figure 13). In this context; we expect UK equity to close the year at ~10% returns. In addition, 2022 will be the year of consolidation, with returns going back to long-term averages (~5%). Nonetheless, a bigger-than-expected economic disappointment paired with a too aggressive policy response could easily derail equity markets, leading to a correction, albeit likely to be milder (~-10%) due to the already low starting conditions.
Figure 13 - UK equity decomposition (y/y change – in %)
Sources: Refinitiv, Euler Hermes, Allianz Research
Authors

Head of Economic Research

Senior Investment Expert