
The employment report for December was a nasty surprise. The consensus expectation had been for a gain of 50k jobs, but we had expected there would be a loss in jobs, maybe as much as -50k. Instead it was substantially worse at -140k. The leisure and hospitality industry suffered the most by far, and it pretty much tells the story of the whole report, and indeed the current economic situation. As Covid continues to surge, and hospitals are becoming highly stressed, States are increasing restrictions. In particular bars and restaurants are facing ever tighter constraints on their operations, forcing job losses. As has been the case all throughout the pandemic, goods producing industries have excelled, but services, which often require face-to-face contact (restaurants, bars, flights, etc.) have fallen behind.

US: Jobs go Negative, Worse than Expected
Dan North | January 8, 2021

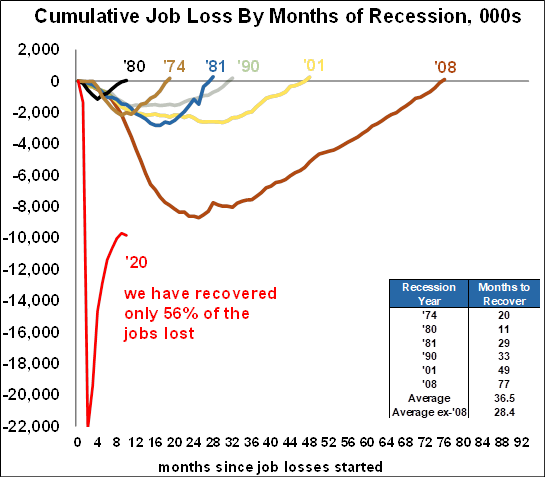
After this report we have still only recovered 56% of all the jobs lost, meaning that there are 9.8 million people who had a job before Covid who are still unemployed now. Many of their jobs will have been permanently lost.
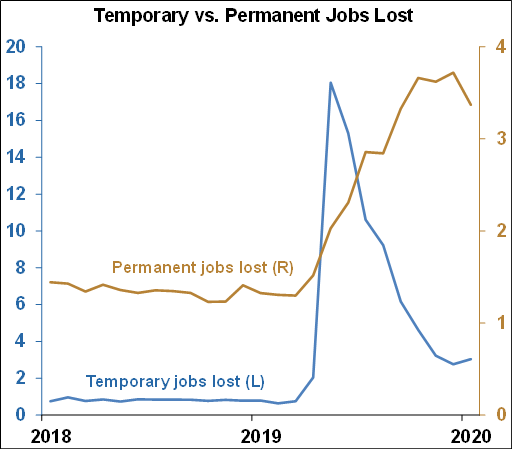
The number of people reporting permanent job loss this month fell slightly but is still at a sky-high 3.4 million. In addition, temporary layoffs rose in December 2020 from 2.8 to 3.0 million.
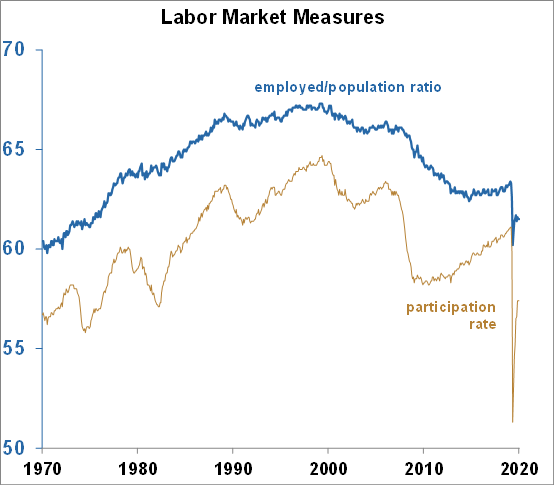
Two critical measures of the labor market, the participation rate and the employment to population ratio remained unchanged at the lowest levels in 43 years. The unemployment rate also remained unchanged at 6.7%.
Despite all the negative data, job growth is likely to return in the next few months as long as things go the way we hope. That is that the vaccines will slow the spread of COVID, allowing the economy to open back up. And when it does, there will be a surge in demand for goods and services that will have been pent up for what will have been a deplorably long year.
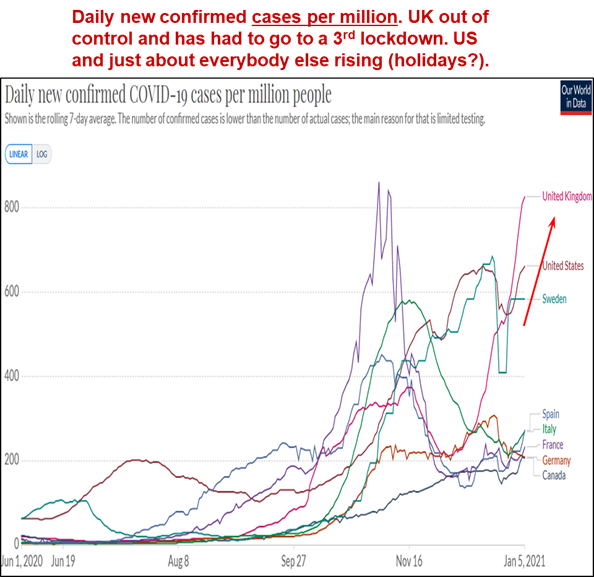
But the path of COVID and the vaccines are critical to this scenario. Unfortunately, neither of those two are looking very good at the moment. Cases in the U.S. were falling a few weeks ago but are now seeing a rapid resurgence. That could be a result of Thanksgiving gatherings and much colder weather in parts of the country. It’s concerning to think of what Christmas and New Year’s gatherings could do. Here are some charts on COVID itself.
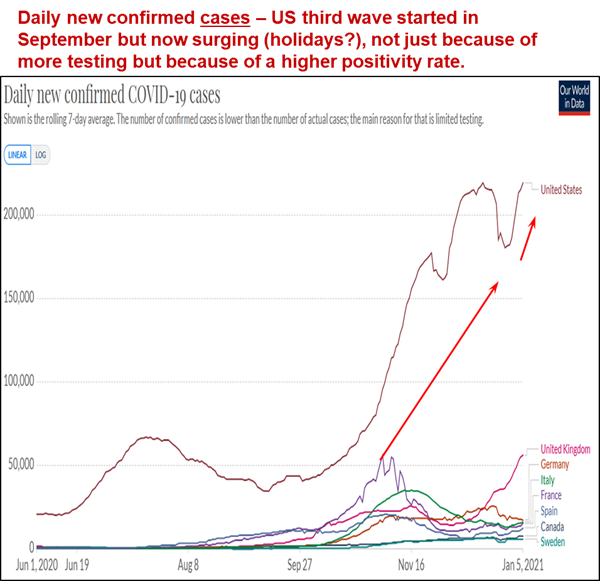
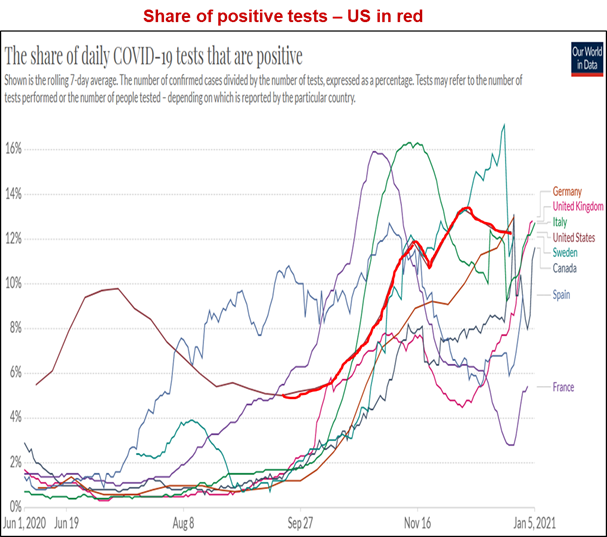
Despite a recent turn down, I think it’s fair to say that since September 2020, the positivity rate in the U.S. has been climbing.
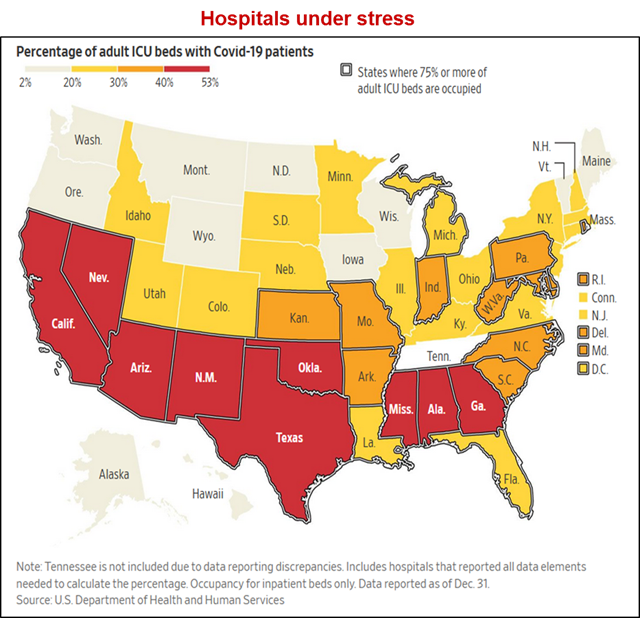
The map below is disturbing. The colors show the percentage of adult ICU beds with COVID patients. The red Sates are at 40-53%, and there are a lot of them, including the two most populous ones, California and Texas. The States that have the double outline are those which have 75% or more of their ICU beds occupied including four of the five most populous, California, Texas, Florida, and Pennsylvania, and EHNA’s headquarters here in Maryland. My sister-in-law is a nurse here at our local hospital. I asked her how it was, how things were going at the hospital. She burst into tears.
The vaccine development was a miracle, done in 11 months. Typically it takes 5-10 years. Chickenpox took 34 years. There is still no vaccine for HIV after 36 years. The fastest previous major vaccine was for mumps and took 4 years. But the COVID vaccine rollout needs to speed up.
So let’s look at how the rollout is going. The first chart shows that the U.S. has administered 5.92 million doses – more than any other country.

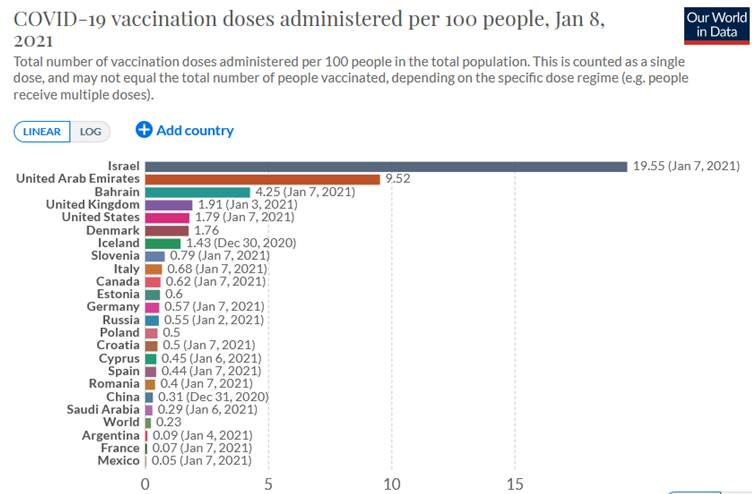
But when you adjust for population and show the doses per 100 people, Israel stands far out above everybody else. The U.S. isn’t too far down the list and is ahead of most developed economies but it’s nothing like Israel.
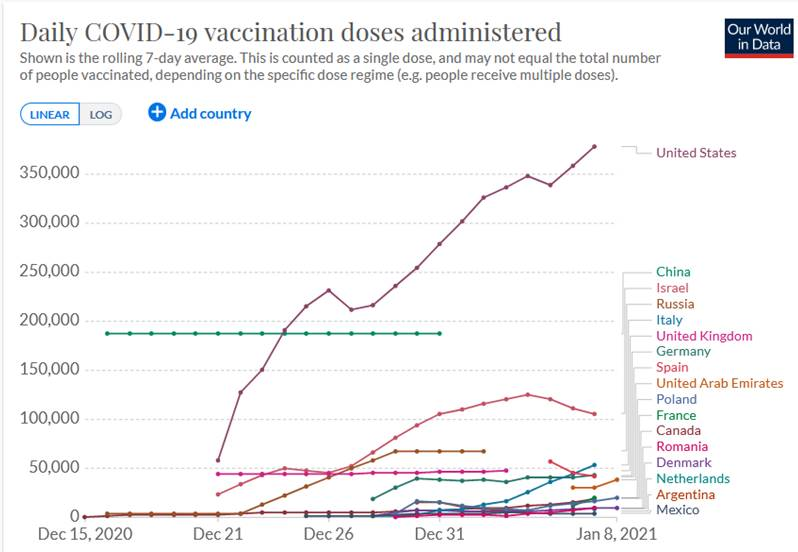
This chart shows the daily rate at which doses are being administered (on a 7 day rolling average). As of January 7th, the U.S. is administering 378,253 doses per day. That’s not nearly enough and I’ll show that below, but note that the daily rate has been increasing steadily, indicating we are getting better at this rapidly.
But once again when we adjust for population, Israel is far, far out in front at 12,263 doses per million people, every day. Everyone else is running at only a fraction of that rate; the U.S. is at a 1,143 doses per million people every day.

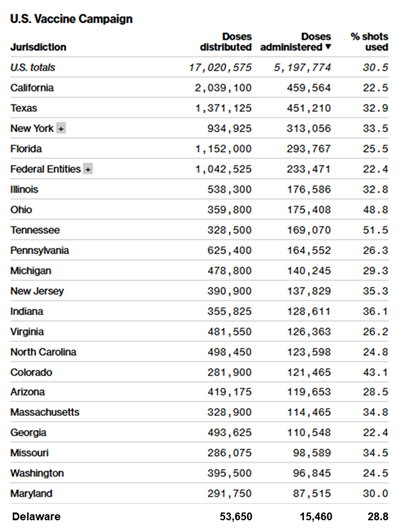
Our big problem is that we have enough doses for now, but we can’t administer them fast enough. Only 31% of the doses delivered have been administered. There are multiple reasons why:
- First, this operation has been running for less than a month. And it included Christmas and New Year’s. Of course it’s starting slowly. And compared to other countries we really aren’t performing too poorly.
- The need for ultra-cold temperatures creates a bottleneck.
- Lack of staff to administer shots. Cases and deaths are at all-time highs, staff have to attend to the sick.
- Distribution and administration plans vary across states.
- Unlike the flu vaccine, people in some States must sign up to be vaccinated, creating extra administrative burdens.
- Providers are leaving vaccines on shelves rather than giving them to people who aren’t in the current priority group.
- Many States have reserved vaccine doses for nursing homes and long-term care facilities, slowing distribution.
- There is a lack of federal funding.
- The U.S. is the world’s 3rd largest country in term of population and area - it takes more time to get to everybody.
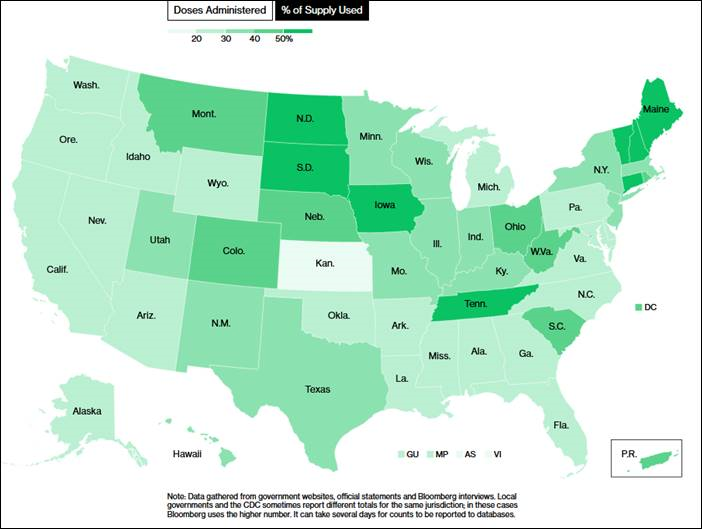
The map and the list show the percentage of the doses which have actually been administered, again averaging 31%.
But why has Israel been so successful?
- Centralized chain of command
- In Israel, all citizens over the age of 18 are required to register with one of the country’s four HMOs in a highly digital system that coordinates with national and local governments.
- Army medics used when needed.
- Israel was an “early bird” in launching negotiations with drug makers and securing undisclosed large amounts of vaccine doses.
- It’s a very small country (149 out of 200) with a relatively small population (95 out of 200).
So how long will it take us to get “there” – to herd immunity? Here are some calculations which assume that we need 75% of the population to get 2 shots to reach herd immunity. I’m not a health expert and I don’t know if those assumptions are good ones, but the exercise is useful nonetheless. The first column shows that at the current rate of 378,253 shots given per day, it will take us 3.6 years to reach herd immunity. However if today (January 8th) we were to ramp up the rate to 2,000,000 shots per day, we could reach herd immunity in 0.7 years. In a rare bit of optimism, I am hopeful that we can do this.

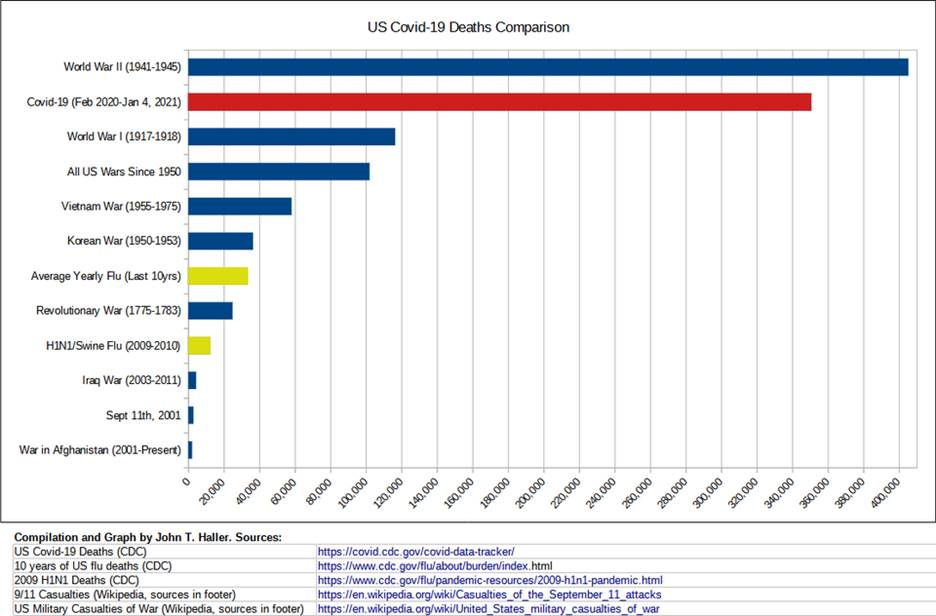
And we need to, especially for the hospitals, but also for what this chart shows. I hadn’t seen it before and I found it shocking. It speaks for itself.
In summary, we lost jobs in December 2020 because of increasing COVID restrictions, and we may lose more in the coming months, but we do expect a rebound in H1 as immunizations ramp up and the weather gets warmer. In the meantime, COVID is surging, putting hospitals under stress, highlighting the need for more rapid administration of the vaccines. We have just started in the past month, so we are not up to speed, but we’re getting faster all of the time and some problems will surely be solved.
But remember, we didn’t even have a vaccine just two months ago. Can you imagine looking at all those grim charts without the hope provided by a vaccine actually in use? It’s been a tough start to a New Year for sure and we have a ways to go, but the outlook is hopeful.
More articles to explore


Get economic & trade content in your inbox
We're always producing new content to help businesses understand economic trends and navigate trade uncertainty.
Sign up for our newsletters to make sure you don't miss anything.
Sign up for our newsletters to make sure you don't miss anything.