US: Jobs Strong but COVID Making a Mess

Dan North | July 2, 2020

June 2020 Employment Report

The June employment report was much stronger than expected, as the economy created (another) record 4.8 million jobs vs. expectations of only 3 million. The previous record before COVID was 1.1 million.  Every industry saw huge increases (except utilities which dropped -3k). Of particular note, leisure and hospitality gained almost half the total, garnering 2.088 million jobs, 14 times as big as the previous record of 151k. Even the beleaguered retail industry gained 740k jobs vs. the previous record of 190k. Still, payrolls are down 9.6% from before COVID. Those who said they were on temporary layoff fell by 4.8 million, and these were likely cases where businesses simply opened back up and employees went back to their jobs (see “low-hanging fruit” below).

Unemployment Rate

The unemployment rate fell from 13.3% to 11.1%, again better than expectations of 12.3%.  It is important to note that the unemployment rate is but one measure of the health of the labor market. The unemployment rate does not include those people who are out of work but are not seeking a job – they are labelled as “not participating in the labor force”. So the labor force participation rate gives us another way to gauge the labor market. A similar gauge is the employment to population ratio and is a simpler and perhaps more powerful concept – it’s just the percentage of the population that’s working. It’s the percentage of the population that’s driving the economy. The point of the charts is that the labor market has a long way to go to recover to pre-COVID, or even average levels.

Cumulative Job Loss

So how long will it take to get all the jobs back? Let’s look at what happened in the previous six recessions going back to 1974. In the chart below, each line represents a different recession, and each line starts at the month that the economy started losing jobs.  For example the brown line represents the most recent 2008 recession, and as you follow it down you can see that cumulatively the economy lost around 9 million jobs in about 24 months.  But then the line started climbing back to 0, meaning all the jobs were recovered, but it took 77 months.  The time to get all the jobs back is shown in the table, and on average it has taken 36.5 months. But 2008 was exceptional, so if we strip that out it takes 28.4 months. Either way it’s around two or three years.  History suggests therefore that it won’t be until 2022 or 2023 before all the jobs are recovered. In addition, I suspect that the massive job gains in May and June were probably “low-hanging fruit” where employers simply called their employees back to their old jobs when their businesses re-opened. We may not get such easy gains for much longer.

Weekly Jobless Claims

The employment report in general is the most carefully watched release of economic data in the world, but there is one big problem with it – it’s from surveys done three weeks ago.

Weekly jobless claims, which represent new applications for unemployment benefits, are of course much fresher, and while they have been falling, unfortunately now they are falling much more slowly. Similarly, continuing claims, which show the number of people still on the unemployment rolls, were falling but now have stalled out.  In fact continuing claims rose slightly last week. Together, they suggest that the labor market has not improved since the employment report from three weeks ago.  

The Impact of COVID

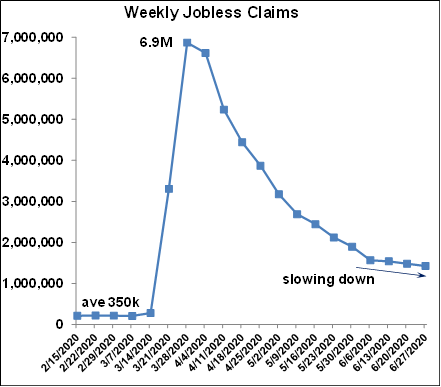
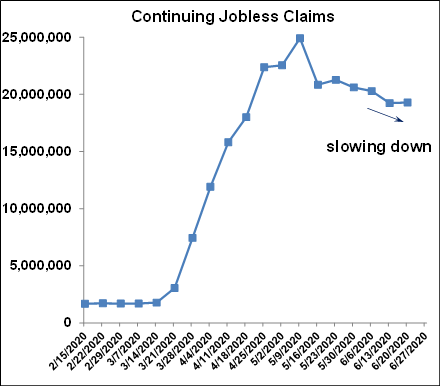
The seeming contradiction between the employment report and weekly jobless claims is not the only anomaly in labor market data.  For example, the ISM manufacturing survey still indicates that employment in manufacturing is shrinking – the opposite of what’s in this morning’s employment report. Another labor market survey similar to the employment report is produced by ADP, and that data seems contorted as well.  ADP’s May report originally indicated that the economy lost -2.76 million jobs whereas the government’s employment report indicated a gain of 2.51 million. Then yesterday ADP revised its May report to a gain of +3.1 million jobs. A +5.86 million job swing from negative to positive certainly raises question.

So how do we resolve all of this contradictory, unstable, and rapidly changing data? I think it’s reflective of two things. First we are in an environment we have never seen before, but we are still using the same survey methods to try to measure it.  Perhaps those methods don’t fit this situation as well as they could.  Secondly, the situation is changing very rapidly. It’s no wonder different surveys with different methodologies over different time periods might show different results.  Which brings us to COVID.

Unfortunately there has been an alarming resurgence of the disease is some states, and more than a dozen states have clawed back or delayed opening provisions.  Clearly this situation will slow the recovery and further wreak havoc with employment statistics.  Some of just a few examples include:

  • Major cities in Florida, and in California, are closing their beaches for the 4th of July weekend
  • Arizona has shut down bars, movies, gyms and water parks, and has pushed back public school openings
  • Texas and parts of California have shut down bars and entertainment venues
  • New Jersey is postponing the restarting of indoor dining

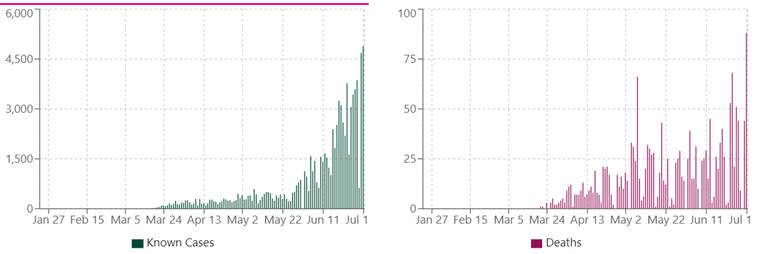
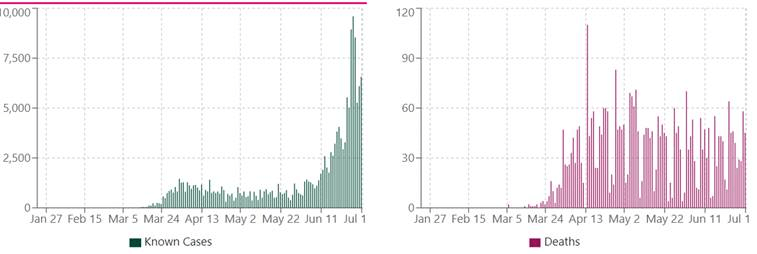
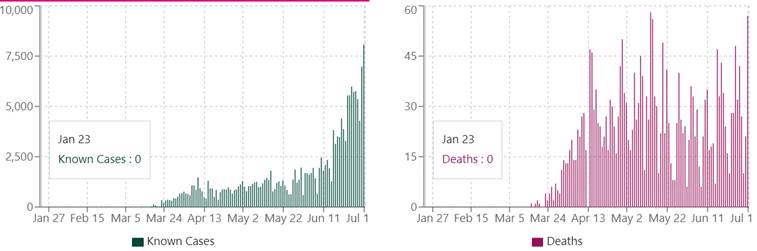
The charts below illustrate the situation in some of the states in question, all showing new daily cases (source: usafacts.org)

The US as a whole:
California:
Arizona:
Florida:
Texas:
There’s a lot going on here with the contradictory and messy employment data, but I think we can draw some conclusions (for the week).  It’s most likely that the labor market has created a large number of jobs in the past two months. But those job gains were likely the easy ones and we shouldn’t expect more big increases like that going forward. Other measures of the labor market, and the historical record suggest we still have a long way to go and that it could be as late as 2023 before we get to any semblance of “full employment”. Similarly the fresher jobless claims data is already showing a slowdown in the otherwise huge improvements in the labor market in May and June. And that would make perfect sense given the resurgence of COVID and the claw back of some state economies re-opening.  At this point, it appears that COVID is the biggest risk to our recovery.
useful description of image if informative and not decoration only.
You can also call an expert at 410-316-6164
We're always producing new content to help businesses understand economic trends and navigate trade uncertainty.
Sign up for our newsletters to make sure you don't miss anything.