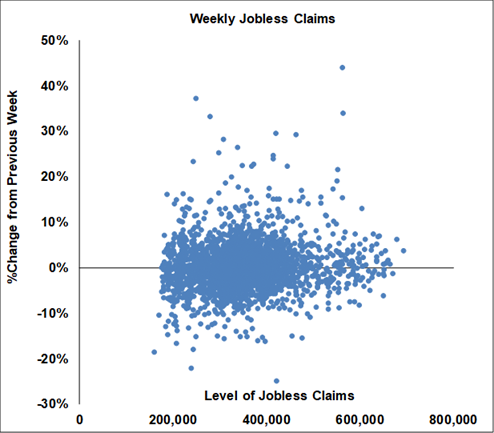
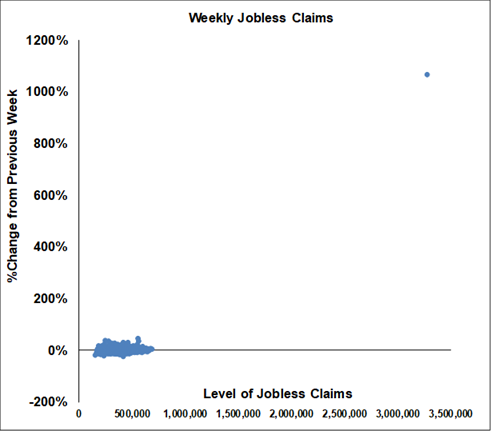
Until last week, the biggest weekly change on record was 43.9%. Last week it was 1064%, 24 times as much.
It’s hard to compare today’s data with anything from before, but here’s an analogy. Suppose you scratch someone else’s car while maneuvering in a parking lot – let’s equate that to a bad weekly report. Then suppose you get into a fend-bender at 10 miles per hour – that’s a recession. But now suppose you’re in a head-on collision at 60 miles per hour – that’s what today is, and it’s a whole different regime. And we can extend the analogy a little further, and that’s where the good news comes in. Today’s cars have such good protective systems that you can survive the head on collision and you can heal from most of the injuries. And it’s the same thing in the economy; we may have been in a terrible accident, but we have the protective systems of massive monetary and fiscal policy to prevent much injury (if it all works that is) and we will heal. It’s going to hurt, but we will heal. And most importantly remember that these jobless claims were deliberately driven up by the government, and that same government is very anxious to drive them back down again.
That’s why we continue to expect to see very dire data like this through the next few months, but it will be followed by a solid recovery later.
Next week there are four particularly important data releases. On Tuesday the Consumer Confidence Index is released, on Wednesday we get the ISM manufacturing index with the non-manufacturing index coming in on Friday. The ISM indexes are going to plummet since those surveys are finished late in the month of March. The Consumer Confidence survey is taken in the middle of the month, just as coronavirus fears were starting to ramp up, but we still expect to see a sharp downturn there.
Next Friday at 8:30 AM we get the most closely watched economic data release in the world, the U.S. employment report. The data for the employment report is gathered on the week of the 12th, a week prior to the jobless claims reported today, so we won’t see numbers as dramatic in next Friday’s report as we did today. However, we know that large parts of the economy were already being shut down when the data was being gathered, so we can expect to see a very unpleasant report indeed.
And to end on a lighter note, as we mentioned we expected a huge number today. After the report, CNBC’s Rick Santelli said, “If you tell someone they’re going to have triplets, don’t be surprised if they come home with three babies”.