

U.S. Blistering Hot Employment Report
Dan North | April 2, 2021
The April 2 employment report for March shows that the breakout expected for this year is indeed underway. This will be a very good year with GDP growth of a rousing 5.3%.
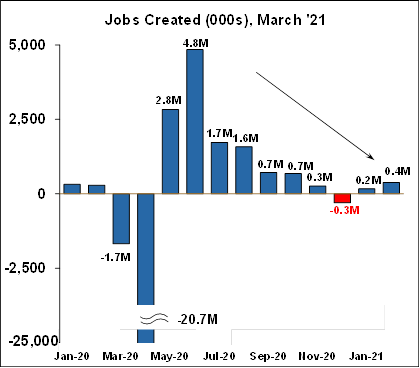
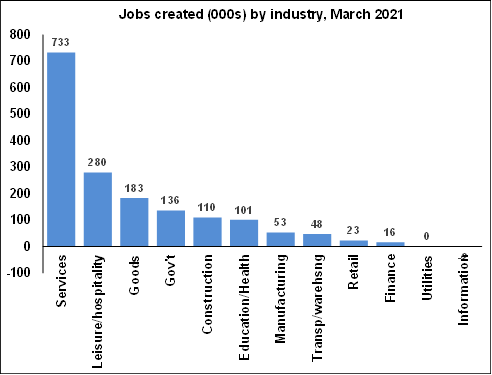
The report came in at a blistering hot pace, showing that the economy created a formidable 916k jobs, far above expectations of 700k. In addition, February was revised up from 379k to 468k while January was revised up from 166k to 233k, for a total upward revision over the past two months 156k. Jobs rose in every major category except for a minor -2k loss in Information. Leisure and hospitality gained 280k jobs, the second consecutive strong month after February’s 384k. Clearly, the lifting of restrictions on bars and restaurants is driving potent growth in this industry, and there will certainly be more gains to come. Construction made a powerful rebound from February’s foul weather and gained 110k in March, which outside of the pandemic recovery months, was the strongest in 31 years. More warm weather and a red-hot housing market will drive even further gains this year. Jobs in education and health services rose a steep 101k as students started to return to school, another trend we expect to see continuing.
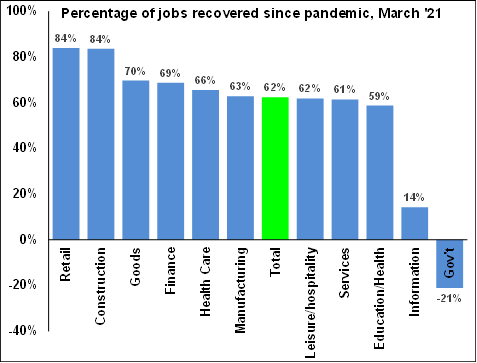
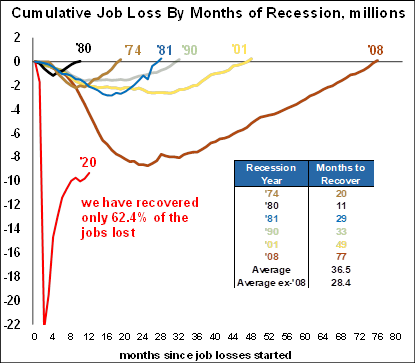
Most major industries have recovered a good portion of the jobs lost except for information, government, and utilities (not shown since it is a very small industry and has not recovered any of the few it lost). Overall the economy has now (04-02) recovered 62.4% of all the jobs lost last year, up from 57.6% last month.
The unemployment rate dropped from 6.2% to 6.0%, which is certainly positive, and a huge recovery from last April’s 14.8%. A broader measure of unemployment dropped from 11.1% to 10.7%, again a dramatic improvement over last April’s 22.9%. A total of 347k workers entered the labor force in March, and as a result, the labor force participation rate ticked up 0.1% to 61.5%, not as much as we would have liked, but still a huge improvement from the pandemic low of 60.2%. Similarly the employment to population ratio inched up 0.2% to 57.8% and while it still is at a low level historically, it is well above the pandemic low of 51.3%.
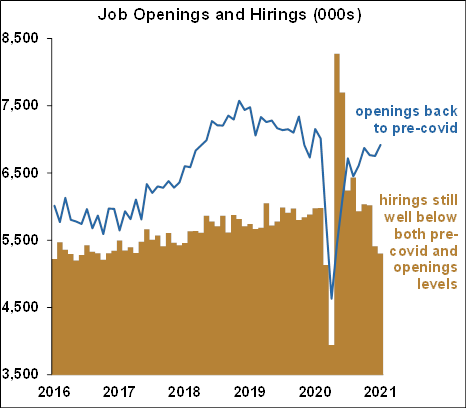
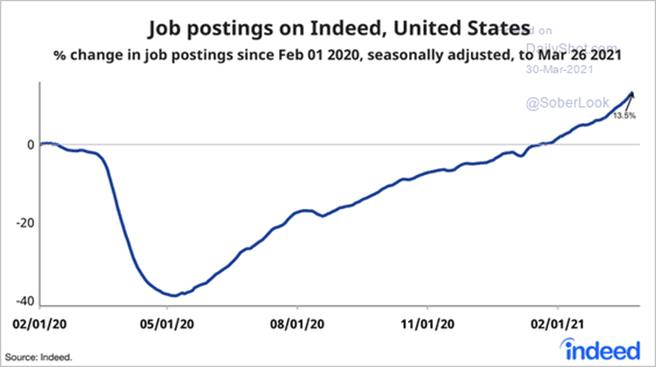
Other measures of the labor market are showing vigorous demand as well. The Job Openings and Labor Turnover Survey (JOLTS) shows that job openings (the blue line in the first chart below) are now (04-02) back to pre-Covid levels. Similarly, job postings on Indeed, as shown in the second chart below, are now (04-02) 13.5% higher than before the pandemic. And according to the Wall Street Journal, postings on Indeed for manufacturing were up 50% y/y and for construction up 45% y/y. But all those openings do highlight one unfortunate aspect of the labor market – the openings are not getting filled. Actual job hirings as shown by the tan columns in the first chart are still below pre-Covid levels and are far below job openings. Manufacturers in particular are desperate for labor (more on that below). There are several reasons for this: some people still have a fear of returning to the workplace and catching Covid, others have become discouraged and have left the workforce, some older workers chose to retire out of the workforce when the pandemic struck, and generous unemployment benefits are giving some an incentive to stay home. These issues will weigh on job growth despite torrid demand, but Covid fears will recede, people will return to the workforce, and incentives to stay home will eventually ease – it will just take a while.
Consumers on the go.
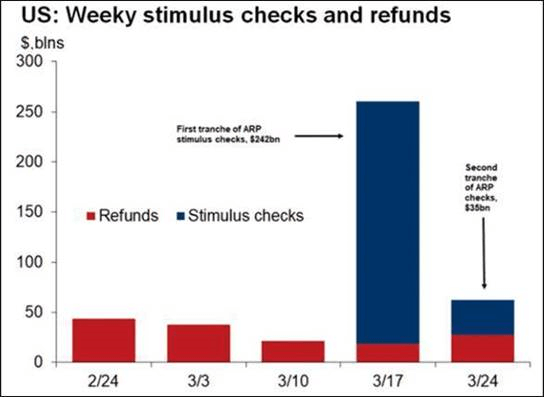
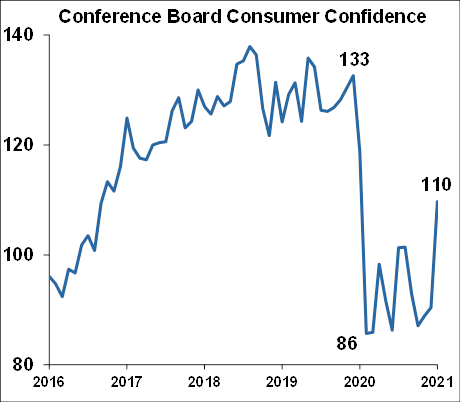
Very high demand for labor is only a part of the current economic landscape. The most recent government stimulus program, the American Rescue Plan (ARP) sent out most of those $1,400 checks in March. Combined with the nearly $2T of excess savings Americans already have stored up (which represents a huge 11% increase above normal annual consumption), consumers certainly have an unprecedented ability to spend. And now (04-02) they also have the second necessary component to consume, the willingness to spend. The Conference Board’s Consumer Confidence Index soared in March to 110, recovering half of the plunge from the pandemic, and landing well above the long-term average of 95.
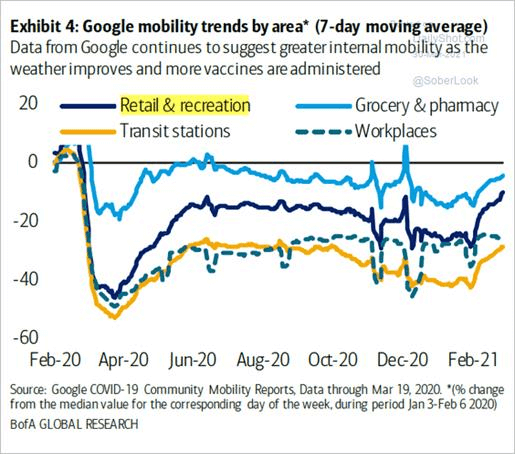
As a result, consumers are heading out, eating at restaurants, getting on airplanes, and going to hotels.
Mobility trends show increases in people moving around, correlated with economic activity.
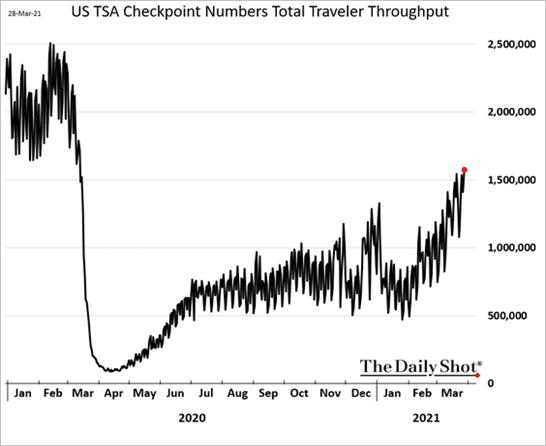
People are flying again.
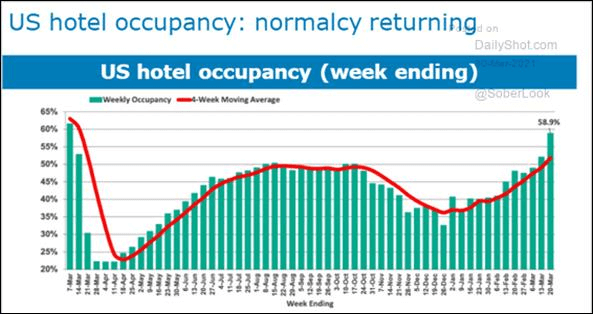
Travelers are checking in to hotels.
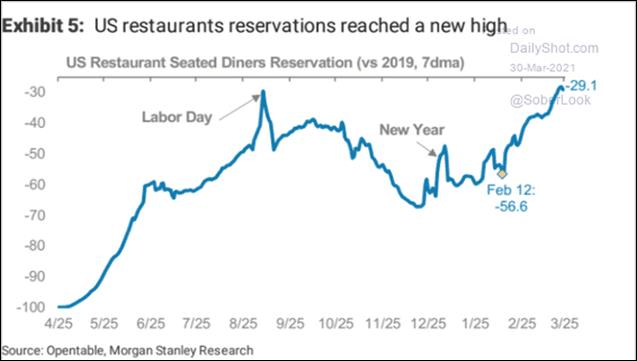
Diners are hungry, and it shows.
And here are two other good charts I showed earlier in the week.
Credit card spending.
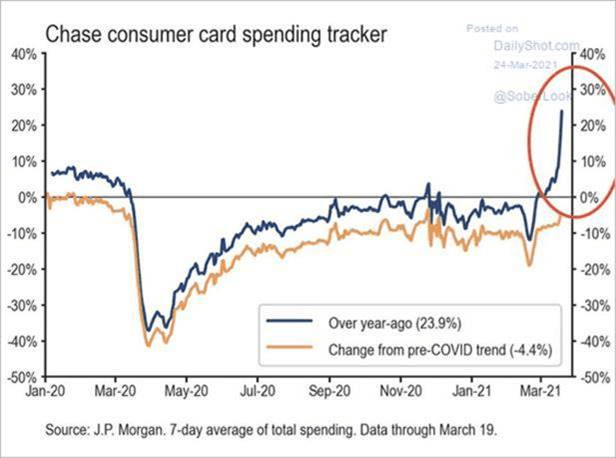
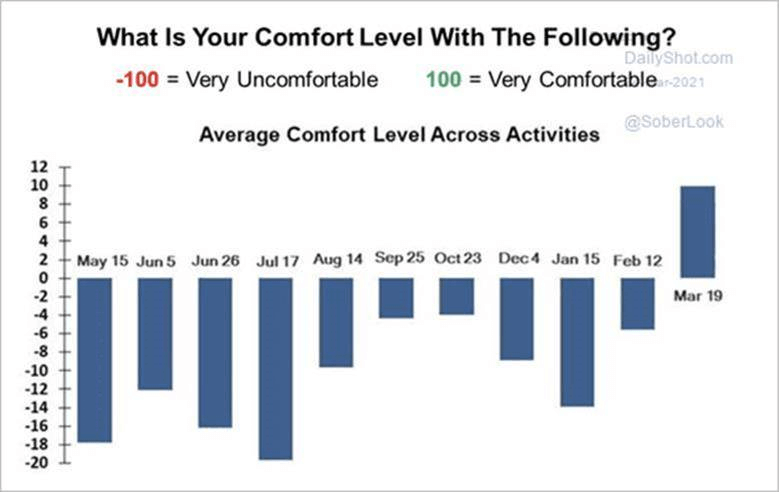
For me, this is the biggest one of all because it shows once again that the consumer is ready to break out. It’s the first time the survey has turned positive since the pandemic. WSJ:” Consumers are more comfortable with various social activities, according to an Evercore ISI survey.”
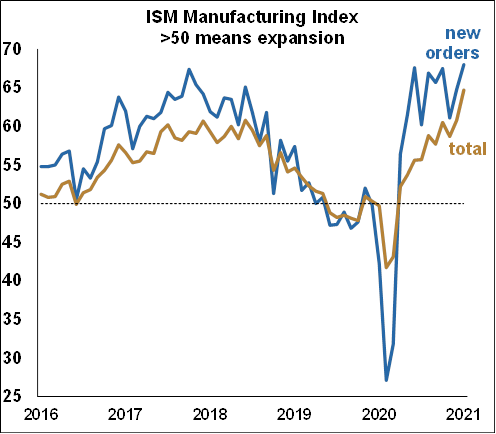
Manufacturing
We touched on the manufacturing sector in the employment report where demand is apparently through the roof. For example, several regional Federal Reserve surveys show a dramatic increase in manufacturing activity. In addition, the ISM manufacturing index rose sharply in March to the highest level in 37 years, while the new orders component of the survey also jumped, landing at the highest level in 17 years. Comments from the survey participants are always revealing and show a combination of sky-high demand, a shortage of labor, and a snarled supply chain (which will only get worse thanks to the jam in the Suez canal):
- “… winter storms slowed our supply chain down… As consumer confidence grows…we do expect orders to increase.” (Computer & Electronic Products)
- “Demand remains strong. Significant supply impacts on raw materials due to the Texas freeze. All major raw-material and suppliers on force majeure.” (Chemical Products)
- “Business conditions are positive for our industry and company. The constraints are mainly related to parts availability... Manpower is also a constraint; hiring new members is a challenge.” (Transportation Equipment)
- “Winter Storm Uri has made daily life in the supply chain quite a challenge. Everything from plastic substrates to adhesives has been significantly impacted.” Food, Beverage & Tobacco Products)
- “The spring and summer months look great for the national oil markets.” (Petroleum & Coal Products)
- “A lack of… talent makes it difficult to keep up with production demands. Qualified new hires are an ongoing challenge. We have had to provide better compensation to keep qualified talent. Raw-material prices are up 50 percent to 60 percent over the last six months…” (Fabricated Metal Products)
- “Widespread supply chain issues. Suppliers are struggling to manage demand and capacity in the face of chronic logistics and labor issues. No end in sight.” (Machinery)
- “Business is even stronger for us this year through the third quarter, and we expect a very healthy growth of our manufacturing sales.” (Electrical Equipment, Appliances & Components)
- “…we are expecting steady improvement through the end of the year. Inflation and material availability, along with logistics, are major concerns.” (Furniture & Related Products)
- “Tremendous stress on the supply chain since the winter storm in Texas. Chemicals are on allocations or unavailable.” (Plastics & Rubber Products)
Other Measures
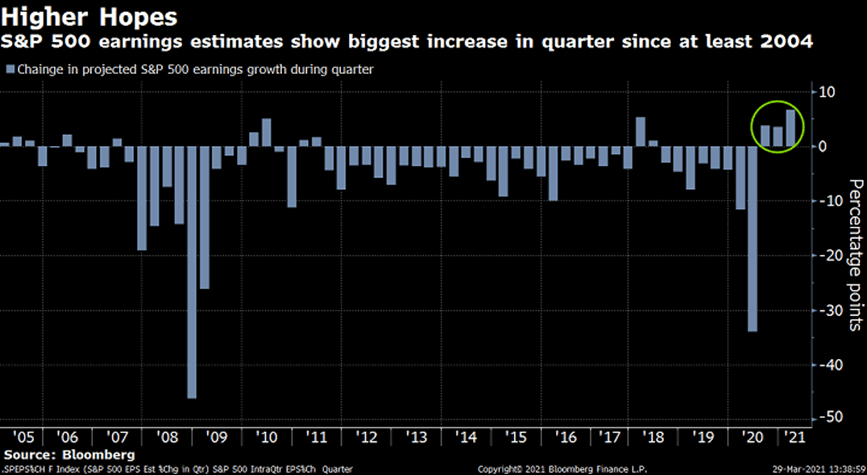
Stock market analysts are also foreseeing a hot economy. According to Bloomberg stocks editor, Dave Wilson: “Analysts’ earnings estimates for companies in the S&P 500 Index are making history this quarter. They resulted in an increase of 6.7 percentage points in projected earnings growth from the beginning of the quarter through Friday, according to weekly data compiled by Bloomberg. The increase is the largest during any quarter since at least 2004, when the figures begin, and has sent the expected growth rate to 22.5%. The first quarter will be the third in a row in which estimates have risen, rather than falling as they have typically done. The streak is the longest since 2005.”
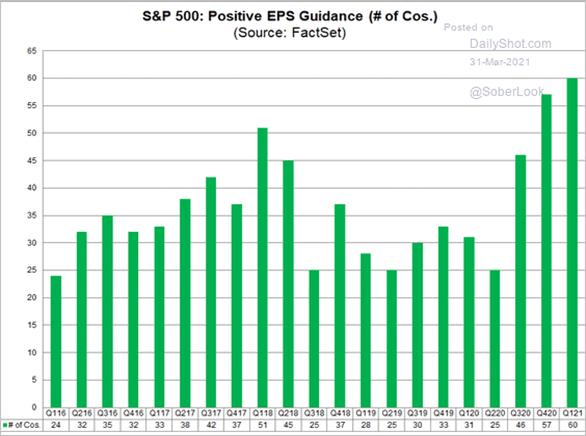
Similarly, the percentage of S&P 500 companies issuing positive guidance on earnings has risen from only 25% in Q2-20 to 60% in Q1-21.
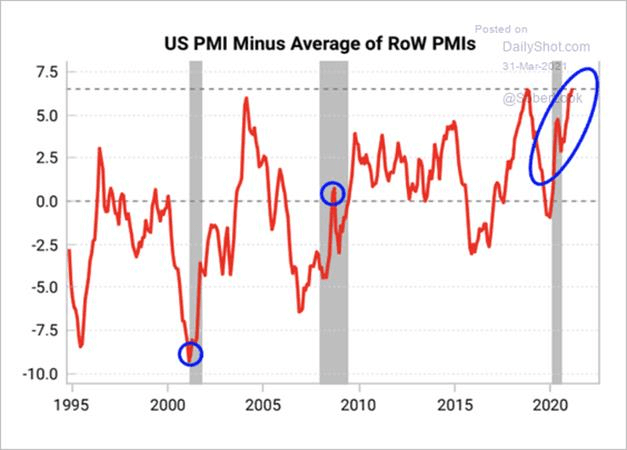
Finally, note the U.S. is recovering more rapidly than the rest of the world (RoW) in aggregate. IHS Markit produces a measure for most major economies called a Purchasing Managers Index (PMI), which is quite similar to the ISM survey in the U.S. The chart below shows that the US PMI is outperforming economies in the RoW on average.
Covid-19
We still need to keep an eye on Covid, because if there is a resurgence of cases and resulting shutdowns, our rosy scenario will be put on hold. However, all the recent data suggests that it is entirely possible the U.S. will reach herd immunity in a few weeks.
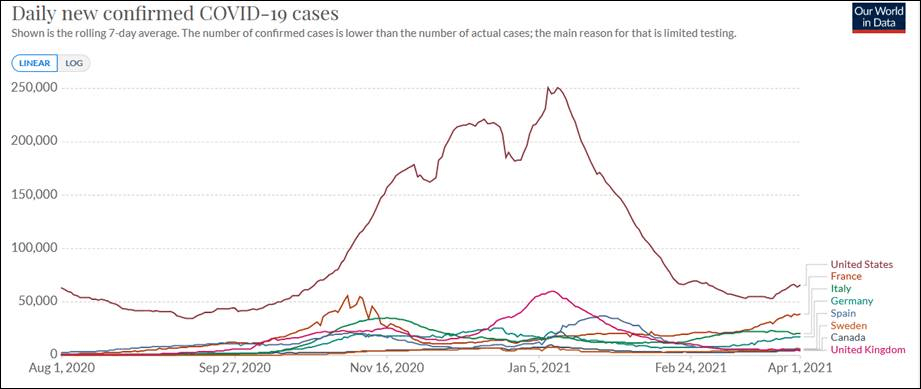
Daily cases: Is there really “impending doom” in the US as one health official recently expressed?
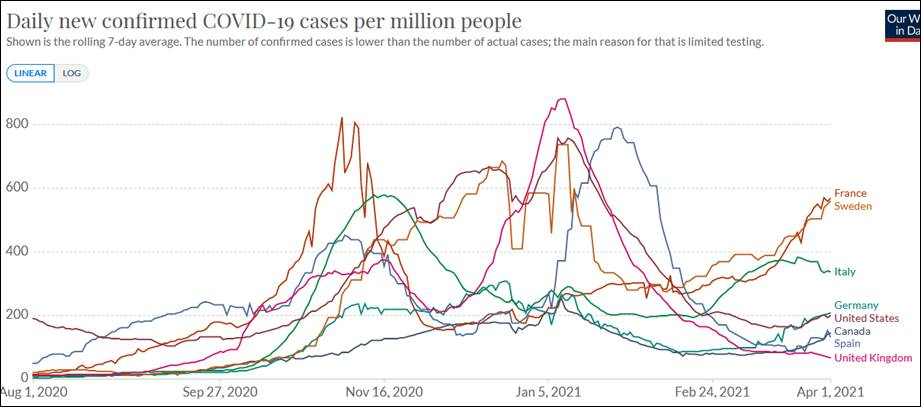
Daily cases per million: Unfortunately France is having to go into its third nationwide shutdown. Sweden looks bad too.
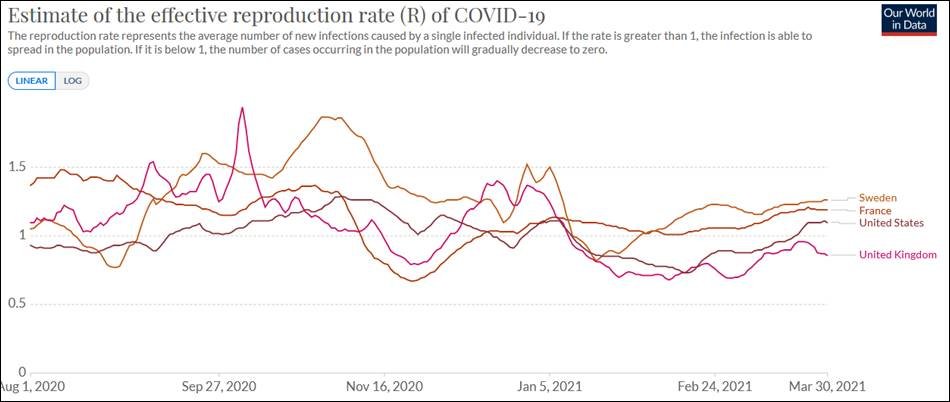
Reproductive rate, unfortunately has crept back up above 1 in the U.S.
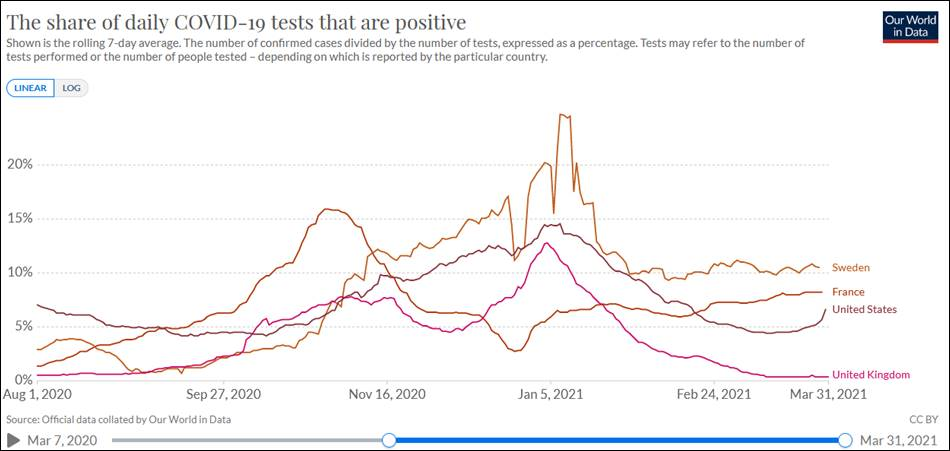
Share of test that are positive. That upturn in the U.S. is suspicious as it seems to get revised down back to flat every week.
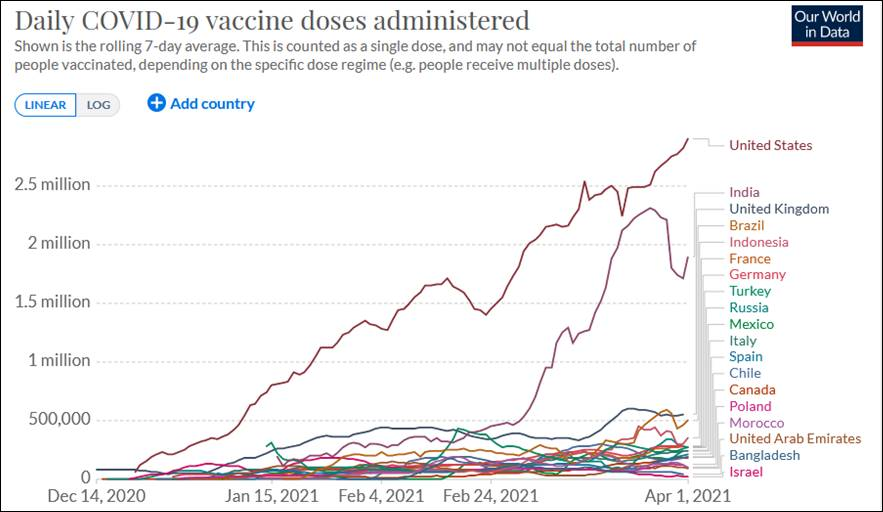
Rate of vaccinations administered. The U.S. is up to 2.9 million doses administered a day, and gets better all the time – this is really great news as it is rapidly propelling us towards herd immunity.
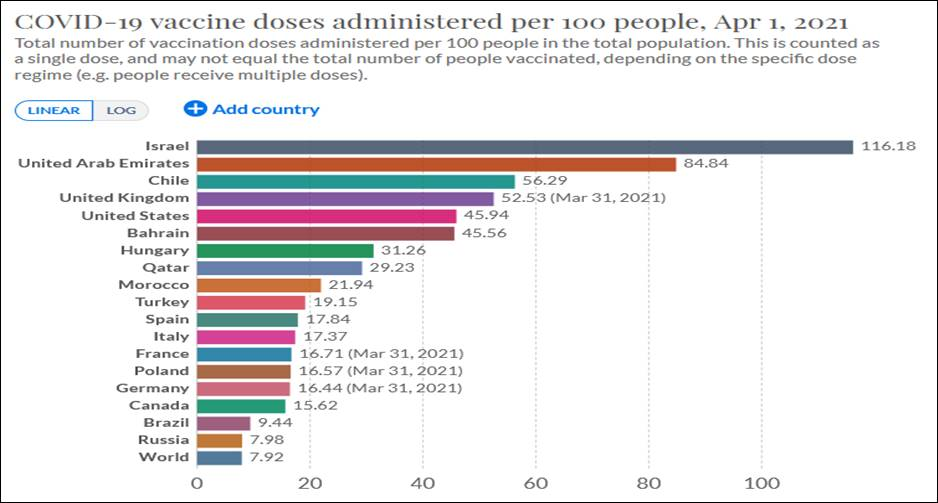
Doses administered per 100 people. 46% of the U.S. population has had 1 or 2 shots.
April 2 was another day of very good data. Strong job growth and demand for labor, stimulus checks, excess savings, rapidly rising consumer confidence, the onset of warmer weather, and the approach to herd immunity add up to quite a bright outlook indeed.
More articles to explore


Get economic & trade content in your inbox
We're always producing new content to help businesses understand economic trends and navigate trade uncertainty.
Sign up for our newsletters to make sure you don't miss anything.
Sign up for our newsletters to make sure you don't miss anything.