Executive Summary

  • The U.S. elections will spark a period of high uncertainty and market volatility until the end of the year. It could take one to two months after 03 November to finalize the results due to the record high use of mail-in ballots amid the Covid-19 pandemic. With the outcome likely to be con-tested by the two camps, a judiciary battle of one or two months is also possible, and market volatility could significantly increase during this time. We identify four possible election outcomes, with our central sce-nario being a short contested victory of Joe Biden, with the Senate still in the hands of the Republicans (40% probability).
  • Choosing between the two candidates will mainly mean choosing be-tween a bigger or smaller federal government. Joe Biden’s economic platform aims at being more redistributive, with a likely net rise of USD3.7trn in taxes over the decade, mostly affecting the highest income earners. It is also demand-side oriented: A Biden win could see public spending rise by USD6.4trn at the horizon of 2030. In contrast, the incum-bent U.S. president offers supply-side oriented propositions, including USD3trn of net spending cuts at the horizon of 2030, coupled with USD1.4trn of tax cuts, causing a USD1.1trn net cut in overall government receipts.
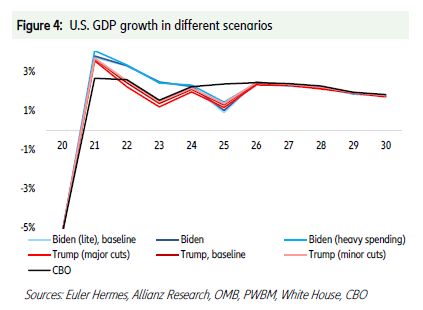
  • What will this mean for short-term growth? As Biden’s platform also em-phasizes improvements in infrastructure, which is usually associated with the highest multipliers that real activity can benefit from, his victory could result in an extra 1pp of real economic growth in 2021. This sup-plementary boost should increase until 2024, reaching at least 1.5pp, 2.3pp and 2.2pp of real growth contribution in 2022, 2023 and 2024, respectively. A Trump victory would sustain real economic growth by 0.9pp in 2021, 0.7pp in 2022 and 0.3pp in 2023 as a result of the recov-ery infrastructure package in the short to medium term. After that, the negative impact of the long-term spending cuts would offet the positive impacts of tax cuts.
  • Over the long-term, public debt will be the real winner of this election. It should reach 159% of GDP at the horizon of 2030 (compared with 137% expected in 2020), a trajectory which is common to the two candidates despite radically different economic orientations (public debt at 151% of GDP at the horizon of 2030 in the case of a Trump win).
  • In this context, we expect the U.S. economy’s growth potential to be structurally impaired. Between 2021 and 2030, it could reach +1.4% with a Biden victory, and +1.25% in the case of a Trump victory.
  • In our view, political choices in terms of reshoring or redistribution will not create a new regime of very high inflation. We expect a slight over-shoot of the 2% target between end -2022 and the beginning of 2023, and a stabilization close to 2% thereafter.

4 Different Scenarios for the Outcome of the U.S. Elections

The 2020 Presidential elections are likely to intensify uncertainty in the U.S.: it could take one to two months after 03 November to finalize the results due to the record high use of mail-in ballots amid the Covid-19 pandemic. President Donald Trump has voiced strong oppo-sition to mail-in ballots, saying he could reject the results if the election is close and it takes an extended period to count all of the votes. In this context, a convoluted process in Congress, even-tually even involving the Supreme Court, is possible.

Tangible signals of nervousness are already visible in different segments of the market, as the price to get pro-tected against adverse moves of volati-lity in November has significantly in-creased. Over the last few weeks, com-panies have rushed to issue debt in anticipation of much more challenging and tighter conditions during and after the elections. Market volatility is likely to significantly increase from Novem-ber until the end of the year because of these elections.

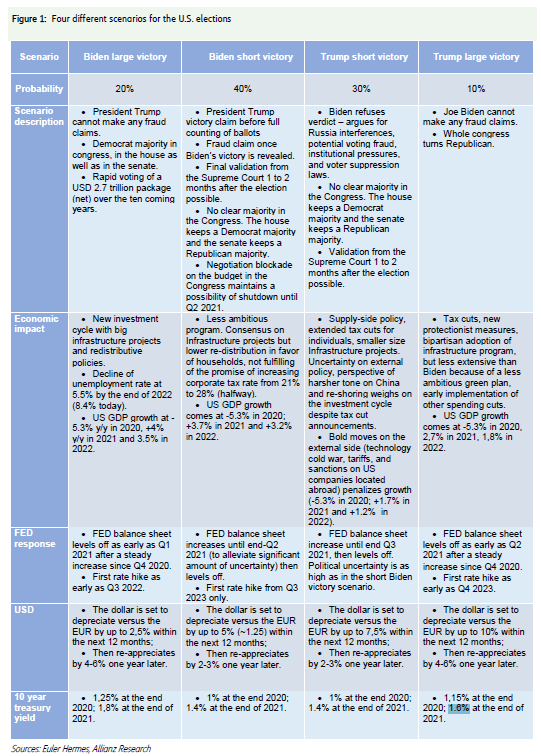
According to public polls, Joe Biden now benefits from 50.7% of vote inten-tions, while President Trump currently stands at 42.6%. However, bet polls suggest that the race could be much tighter. We have identified four different scenarios, with impacts summarized in Figure 1.

Scenario 1

Short contested victory for Joe Biden (40% probability), with the Senate still in the hands of Republicans. In this scenario, President Trump con-tests the outcome and Supreme Court has to validate the outcome after pre-cise recounting. Over the medium-term, because of Republicans still controlling the Senate, Joe Biden has to wait until the second half of 2021 before seeing an effective execution of his economic platform (starting with infrastructure projects) and has to compromise on the most liberal aspects.

Scenario 2

Short contested victory for President Trump (30% probability), with the Senate still in the hands of Republi-cans. Democrats ask for precise recoun-ting. President Trump has also to wait until the second half of 2021 before we see a materialization of a large wave of new tax cuts, while infrastructure projects could receive a swifter appro-val of the Congress because of their bipartisan aspect.

Scenario 3

Large victory for Joe Biden (20% probability), with a clear majority in the Congress for Democrats. In this case, the new U.S. President can imple-ment his economic platform quickly with more liberal orientations. The mul-tiplier impacts are much stronger and quicker. In the beginning of 2021, more leftist or liberal orientations could

trigger a significant correction of the equity market, requiring a strong inter-vention of the Fed in order to tame vo-latility. This instability would last only during Q1 2021 as the perspective of a new investment cycle would reassure the market later.

Scenario 4

Large victory for President Trump (10% probability), with no clear majority in the Congress. The House remains in the hands of Democrats. President Trump manages to imple-ment tax cuts albeit with delays (second half of 2021). His foreign policy is more assertive, in particular targeting China, with negative impacts on global equity markets. De-globalization would accelerate at a global level.

Economic Platforms: How Big Should The Federal Government Be?

Unsurprisingly, Biden and Trump have radically different ideas for the scope of federal government involvement in the U.S. economy and both plan (see appendix 1 for a detailed comparison) on doing much more than simply pay-ing lip service to their respective politi-cal parties’ paradigms in 2020 itself. Indeed, choosing between Biden and Trump on 03 November will also, if not mainly, mean choosing between a big-ger or smaller federal government.

Joe Biden’s economic platform aims at being more redistributive

Biden’s Vision for the United States al-most has a 1930s New Deal-ish tone, with massive spending plans that go by the trillion and a strong emphasis on improving the country’s infrastructure first.

Infrastructure projects at the core of a green revolution

The Biden Plan to Invest in Middle Class Competitiveness will have the U.S. federal government disburse no less than USD1.3trn to invest in addi-tional and improved infrastructure: 23% of this will be dedicated to housing, as part of the USD640bn Housing Plan, 1.5% to investing in rural broadband, 7.7% to school infrastructure, 2.3% in small business funding and 0.8% in transit projects that serve high-poverty areas. The Biden Plan for a Clean Ener-gy Revolution and Environmental Jus-tice accounts for the lion’s share of the entire economic platform, bringing about USD2trn in additional investment over the course of four years. This spending colossus should entail USD300bn dedicated to R&D, through the Biden Plan for Investment in Re-search & Development and Break-through Technologies, as well as USD400bn mobilized in favor of a pur-chase program through the Biden “Buy American” Plan.

Defending Obamacare

The Biden platform will likely incorpo-rate policies similar to those proposed or enacted during the Obama admin-istration, and even expand upon them by trying to reduce the age of eligibility for receiving Medicare to 60, creating a public option for health insurance, ex-panding the Medicaid program and trying to rein in pharmaecutical costs as well as “surprise billing”, which hits pa-tients who go to a medial provider out-side of their insurance companies’ net-work. The third behemoth spending plan will therefore – unsurprisingly – deal with health. For one thing, the Biden Plan for Mobilizing American Talent and Heart to Create a 21st Cen-tury Caregiving and Education Work-force will allocate no less than USD775bn to funding child and elder care. Additionally, the Biden Plan to Protect and Build on Obamacare will inject USD750bn into strengthening the previous U.S. president’s famous re-form. Finally, the Biden Plan to End the Opioid Crisis will disburse USD125bn with the goal of ending the on-going opioid epidemic.

To finish, Biden has also mentioned wanting to strongly tackle the highly debated student loan problem in the U.S., although in this case giving a clearly defined cost might not be a piece of cake. Indeed, estimates sug-gest the problem could amount to as much as USD2.9trn, far above Biden’s usual communication, putting forward a cost of USD750bn.

A return to the pre-Trump era in terms of taxes 

The Biden presidency would also cause major shake-ups in federal receipts, mostly channeled through substantial tax increases. In 2017, President Donald Trump’s Tax Cuts and Jobs Act ended the bracket system organizing corporate income tax, leading to a 14pp drop in the marginal rate (which became the only rate applicable) down to 21%. It also cut by half the minimum tax on global income originating from intangible assets such as patents and trademarks, as well as copyrights (known as GILTI); repealed the corporate alternative minimum tax and rearranged the graduated personal income tax system, notably by decreasing the marginal tax rate by 2.6pp down to 37%, among other changes. Joe Biden’s Tax Plan would reverse much of this by: 

  • Increasing the now unique corporate income tax rate by 7pp to 28%,  re-introducing a 15% minimum book tax on corporations whose income goes beyond USD100mn, 
  • Limiting itemized deductions,  repealing Trump’s reform on the taxation of GILTI,
  • Taxing capital gains at ordinary income tax rates instead of the current 23.8% rate for those earning over USD1mn 
  • And subjecting incomes above USD400,000 to the 12.4% Social Security payroll tax. 

Biden would also eliminate the carried interest tax preferences for partners of private equity and hedge funds, and is likely to raise the maximum applicable deduction above USD10,000 for state and local taxes affecting individuals. The beneficiaries of this last measure are likely to be residents in high taxed states such as New York, California and New Jersey, which by tradition vote Democratic, and are still resentful of what they perceive as a Republican partisan effort to hurt them in the 2017 Tax Reform bill. In total, the Biden Tax Vision may raise around USD4trn depending on the dynamic effects caused by the numerous stimuli packages mentioned by the former Vice President if elected. 

Also on a Biden agenda will be efforts to expand retirement savings, particularly among people with lower incomes. The current system, which relies upon 401K and other qualified employer sponsored plans, provides a deduction for those who save. Critics argue that that this provides more benefits to the wealthy, as they pay taxes at the high effective rate of 37% and thus get a bigger deduction than lower paid workers. Believing that tax incentives should be used to broaden the number of people who have retirement plans and increase their savings rates, the Biden proposal would replace deductions with tax credits to equalize the benefits. 

Finally, Biden favors establishing a government- sponsored retirement account option that would make it easier for small employers to establish a retirement program for their employees. It would directly compete against private fund managers.

President Trump’s economic platform is more about supply-side policies 

Although the Republican party has not published an official political platform for the 2020 presidential election, instead stating it would continue to abide by the ideas pushed forward over the course of Trump’s current term, we do have some visibility on the debt and budget paths if Trump were reelected. 

In February 2020, the White House released its budget projections over the course of the current decade. We pair this document with the latest announcements regarding the so-called CARES Act – Coronavirus Aid, Relief, and Economic Security Act – implemented amid the Covid-19 pandemic.

Large spending cuts envisaged

In its budget vision, the Trump adminis-tration plans on faithfully complying by the Republican party’s motto, which emphasizes the idea of a smaller go-vernment, by enacting major spending cuts amounting to almost USD3trn in total. To begin with, if chosen to pursue a second term, President Trump will further slim the budget dedicated to health. For one thing, costs associated with Medicare and Medicaid could drop by USD785bn; then, Trump’s Vi-sion for Health Reform could materia-lize through an USD845bn spending cut. Moreover, discretionary spending might drop USD1.95 trn over 10 years, including USD400bn on the defense side. A series of welfare programs could lose USD220bn in funding; federal em-ployees may have to live without va-rious perks, the cost of which amounts to USD90bn; the postal service might be reformed to need USD95bn less than currently, farm subsidies may de-crease by USD50bn, and education could lose no less than USD170bn, among other cuts.

The Trump administration does intend to pass a USD1trn recovery infrastruc-ture plan in the short term, added to an initially planned USD275bn infrastruc-ture package mainly aimed at impro-ving the highway network. Finally, USD45bn will be disbursed in favor of scholarships and USD20bn towards financing parental leaves, among other minor increases.

Fiscal revenues to be boosted by un-leashed growth on the back of persis-tently low taxes

In the receipt department, the Trump Vision is reinforced with an extension of the currently enforced tax overhaul on individuals beyond 2025. Depending on dynamic effects impacting GDP growth, this measure could decrease revenue by around USD1.4trn. Finally, under the form of additional fees and premia, combined with slimmed tax incentives, the Trump administration aims at raising around USD260bn in supplementary receipts. Consequently, overall revenue may suffer a net loss close to USD1.1tr.

Impact on Growth in the Short Run

Based on the various shaded areas underlined in both candidates’ political platforms, we envisage no less than six forecast possibilities, each one putting forward its singular debt, GDP and defi-cit trajectories. Under “Trump (minor cuts)”, President Trump could only im-plement a quarter of his planned spen-ding cuts by 2030, under “Trump, base-line” half of them and under “Trump (major cuts)”, all cuts would be con-ducted successfully over the course of the decade. Similarly, based on the va-riations in the effective cost associated with the Biden Student Debt Plan, we have chosen to study three Biden paths for the debt, GDP and deficit trajecto-ries. “Biden (lite), baseline” implies a $750bn plan, “Biden” suggests a cost of $1,220bn, while “Biden (heavy spen-ding)” points to $2,920bn.

A Biden presidency could see U.S. fiscal policy producing positive results by reactivating a new investment cycle from H2 2021. The more redistributive economic platform should support growth by +1pp, albeit to a lower ex-tent compared with 2020 (+1.7pp im-pact on growth of the USD2.2trn CARES Act), as direct cash payments to house-holds in particular had quicker and higher multiplier impacts. However, if Biden wins, the likely division within the Congress could result in delayed execu-tion, resulting in less than USD500bn being spent in the first year of the new Presidency.

If elected, Biden’s plans could likely cause the U.S. federal public deficit to jump between 1.1pp (to 5.7% of GDP) and 1.9pp (to 6.5% of GDP) beween 2019 and 2030, depending on the true cost of his plan to fix the student debt problem. However, in compensation, GDP will receive a boost over the course of the decade. Indeed, the majo-rity of Biden’s extra spending tackles the need for additional or improved infrastructure, which is the type that is usually associated with the highest mul-tipliers that real activity can benefit from. Our forecast point to an extra 1pp of real economic growth in 2021 due to a stimulus package of around USD320bn. This supplementary boost should increase until 2024 – that is, over the course of Biden’s first, if not unique, term – reaching at least 1.5pp, 2.3pp and 2.2pp of contribution in 2022, 2023 and 2024, respectively. After that, should Biden be reelected, the effec-tiveness’ of the stimulus program should slowly fade. All in all, we esti-mate at $2.7 trillion the net size of a new stimulus affecting the U.S. econo-my under a Biden presidency, spread over a 10-year timeframe.

The four trajectories of growth pre-sented below correspond to the diffe-rent options achievable by Biden or Trump based on the multipliers pre-sented in Figures 2 and 3.

Impact on Deficits and Debt

Covid-19 has already caused U.S. public debt to swell further to 137pp of GDP, from 109pp in 2019. So the election will be about picking between high or alarmingly high when it comes to debt. Under Biden, public debt would consistently grow at an average pace of +2.2pp each year between 2021 and 2030, eventually standing at 159pp. In case the cost of the Biden Student Debt plan ends up reaching levels far above $750bn, the debt could stand at 160pp to 166pp by 2030. Should Trump start a second term, and if his intended policies are to be continued all the way through the entire decade, U.S. public debt would keep on increasing at an average yearly pace of +2.5pp between 2021 and 2025, before consistently decreasing -1.3pp annualy (on average), eventually reaching 142pp. If President Trump’s spending cut measures were only partially enforced, which is more likely to happen, U.S. public debt would stand at between 151pp and 155pp in 2030. 

Indeed, there is substantial doubt the Trump administration will manage to enact all desired spending cuts, considering the potential impact on economic growth this might entail, which will only partially be compensated by the concomitant tax decrease. As a matter of fact, all adjustments considered, the federal budget might save no less than USD1.9trn over the course of 10 years, bringing the deficit down 1pp to 3.6% of GDP in 2030 from 4.6% in 2019, which, said differently, also amounts to falling 6.1pp from the post-Covid 19 crisis level of 9.6% in 2021. Nevertheless, our estimate for the public deficit stands far above the White House’s, which, in February, clearly underestimated the negative impact of the tax overhaul extension beyond 2025 on government receipts, notably due to unrealistic assumptions regarding GDP growth. Consistently around 5% year-on-year in nominal terms from 2021 to 2030, too strong a GDP growth artificially inflates tax receipts and dramatically distorts the base effect when calculting the public deficit in GDP percentage points. Consequently, the Office of Management and Budget – the POTUS’ main expert council on the matter – forecasted that deficit would decrease to 0.7% of GDP in 2030, no less than 2.8pp below our prevision. And that’s in the case Trump manages to carry on with the spending cuts as he plans! For that matter, we envisage two other “Trump-scenarii”, in which only 50%, or even 25%, of all spending cuts would be enforced. In such cases, the public deficit would gain 0.2pp or 0.8pp reaching 4.8% or 5.4% of GDP – which stands 0.1pp above the CBO baseline, at 5.3pp – between 2019 and 2030.

Impact on External Relations

The U.S. “Cold Peace”conflict with Chi-na will likely remain throughout the 2020s and the Biden mandate of rein-ing in China will not be that much different than Trump’s. However, what can be expected to change is that Biden will seek to reaffirm relations with tradtional U.S. allies that were fractured by President Trump, bringing them into a broader coalition of coun-tries that togther would work to ensure that China adheres to international rules. Tariffs would be used strategical-ly but not viscerally. Biden would be anxious to have China address climate change and also to apply pressure on North Korea to rein in militarism and provocations. Both countries remain intertwined economically, but expect continued Congressional efforts to re-strict Chinese investments in the U.S.. Under Biden, the U.S. would also seek to reaffirm the NATO and EU relation-shiops and assure Europe that the At-lantic Alliance remains very important. The U.S. could continue efforts already undertaken by the Obama and Trump administrations to get NATO members to increase their defense budgets, and also to secure their cooperation in com-batting cybersecurity, terrorism and other risks to the international order.

A second Trump Administration would probably not be all that different than a first one. The President would contin-ue to promote de-regulation, urge the Federal Reserve to pursue a more ac-commodative monetary policy and deprioritize climate change is-sues. President Trump has shown disfa-vor for international institutions and we expect this would continue.

Impact on Long-Term Growth Potential

To compare the impact of the two economic platforms on the long-term growth, we first estimate the U.S. economy’s long-term growth in func-tion of four different variables, i.e. pro-ductivity growth (over one year), growth of the active population (yearly), the share of imports as a per-centage of GDP and the size of public debt as a percentage of GDP. We as-sume that these four variables will take different trajectories under a Democrat or Republican administration. Our esti-mate reveals that the growth potential is positively explained by the growth of productivity (coefficient C(1) = 0.07), the growth of the active population (coefficient C(2) = 0.26) and the share of imports as a percentage of GDP (coefficient C(3) = 0.36, meaning that re-shoring activities are bad for the growth potential). However it is negati-vely determined by the size of public debt (coefficient C(4) = -0.03).

Separately, we create a dummy va-riable “dummy 1”, using 1 for a Demo-crat administration and 0 for a Republi-can one. Inversely we create a dummy variable “dummy 2”, using 0 for a De-mocrat administration and 1 for a Re-publican one. Explaining the growth of productivity and the active population between 1971 until today with the two dummy variables and a trend we ob-tain the following results:

  • Historically, Democrat administra-tions have a lower performance in terms of productivity growth (-0.6 pp below trend) versus Republi-cans (0.4 pp above trend)
  • Historically, Republican administra-tions have a lower performance in terms of growth of the active popu-lation (-0.3 pp below trend) com-pared with Democrats (+0.4 pp above trend)

A Biden administration would make immigration reform a priority, and try to provide some degree of protections to people who came to the U.S. illegally but who have been here for many years and have jobs and family, DACA recipients. Along with the priority given to education and health, this would pay a positive role in the growth of the ac-tive population. In contrast, with a con-tinuation of the Republican administra-tion, supply-side policies would be more beneficial to productivity, while stricter conditions on immigration and lower spending in health and educa-tion could lead to lower growth of the active population. Taking into account the following assumptions:

  • Below / above trend growth of productivity in the case of a Demo-crat / Republican administration
  • Above / below trend growth of the active population in the case of a Democrat / Republican administra-tion
  • Public debt reaching 160% of GDP at the horizon of 2030 in the case of a Democat victory and 150% of GDP in the Republican case
  • The share of imports as a percen-tage of GDP returning to a pre-Trump era level (14.3% of GDP at the horizon of 2030 versus 13.6% in Q2 2020) in the case of a Demo-crat victory and a further decline to 13.3% at the horizon of 2030 in the case of a Republican victory

We eventually obtain an average po-tential of growth of +1.4% between 2021 and 2030 in the case of a Demo-crat win and +1.25% in the case of a Republican win.

Would a Biden victory be destabilizing for inflation?

From a Democratic party perspective, the Covid-19 pandemic has further re-vealed the fact that income and social inequality are more pevasive than pre-viously thought and for the sake of na-tional unity require redressal. The Biden platform is not designed to displace the private marketplace, but instead to infuse it with greater responsibilities including assistance in promoting diver-sity in the workplace, and adhering to ESG guidelines. Expect also an increase in the federal minimum wage. In order to estimate the impact on inflation of the economic platform of a more redis-tributive economic policy, similar to the one proposed by Biden, we build equa-tions using variables allowing us to fac-tor in long-term political orientations such as:

  • Unit labor costs, which currently have a higher probability to mirror a more re-distributive fiscal policy should Biden win the election
  • Oil prices, which can be seen as energy cost, the latter possibly exposed to up-ward pressure because of a rapid tran-sition to greener energy
  • The share of imports in the economy, in order to factor in any trend favorable to reshoring, which is favored by the two candidates
  • The monetization of debt measured by the free-float, which is a trend observa-ble across developed countries and required for the planned accumulation of debt by the two candidates
  • The output gap or growth deviation from trend in order to factor in long-lasting macroeconomic shocks

All coefficients have a conventional sign: an acceleration of unit labor costs triggers an acceleration of CPI inflation. Any long-term policy of reshoring is like-ly to generate higher inflation as well. Debt monetization nurtures inflation over the medium-term. We have identi-fied three regimes of inflation in func-tion of the assumptions that we take on all the exogenous variables of our mod-els. Debt monetization and reshoring, even in the central case, have the po-tential to bring inflation above the 2% target, albeit only in a temporay man-ner in our central scenario. This scenario is clearly conceivable as evidenced by the recent decision of the Fed to re-place its 2% objective with an average approach of it.

We're always producing new content to help businesses understand economic trends and navigate trade uncertainty.
Sign up for our newsletters to make sure you don't miss anything.