Looking Past the Election

Dan North | November 3, 2020

I think it’s fair to say most of us are concerned about the election night on November 3 one way or another. But let’s try and look past it to see what we can make of the future of the economy given what we know at the moment.

Real personal consumption expenditures (PCE), which drive 70% of US economic activity rose 1.2% m/m in September. That was a bit better than August but way down from 8.5% in May and 5.9% in June. Similarly, the disposable (after-tax) personal income (DPI) needed to fuel consumption grew 0.7% in September, and again, that’s way down from the boost provided by the CARES act in April. It’s simple, people are running out of income. And the income they are receiving is not getting spent, it’s getting saved. Income – spending = savings.

Here are the real (after inflation and after taxes) growth rates of consumption and income.

Usually, growth rates are more interesting, but at the moment looking at the nominal (not inflation-adjusted) levels – that is actual dollars, is informative as well. The first two charts show income and then spending, and they are both on the same vertical scale so you can see that consumers don’t spend all of their income. The third chart shows the difference between income and spending, savings, and that chart clearly shows that even though the income boost from the CARES Act has disappeared, consumers are still saving much more than they normally would. Since they are saving it and not spending it, they are not driving the economy.

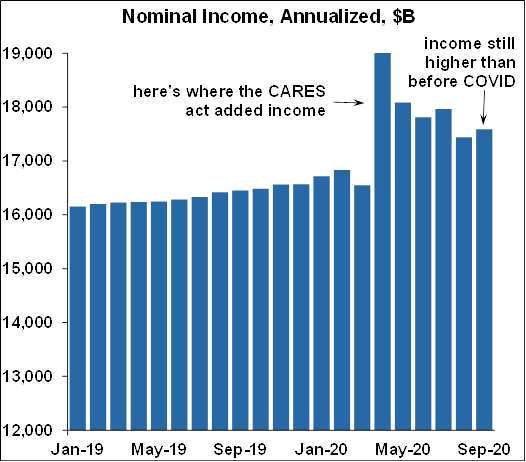
Speaking of income, the CARES act has made unemployment benefits a bit complicated.  Normally, an unemployed person first applies for Unemployment Insurance (UI) through their states, and in most states, these benefits run 26 weeks or more. The CARES Act created an additional Pandemic Emergency Unemployment Compensation (PEUC) program which provides an extra 13 weeks of benefits, but those will run out no matter what on December 26. So someone who filed for state UI early on in the shutdowns, say in the middle of March will have neither regular state UI nor PEUC income at the end of the year. Someone who filed for state UI later, say August, will also lose PEUC on December 26, but they will still be receiving regular state benefits through February 2021. The CARES act also provided one more type of UI for those who typically wouldn’t qualify for state UI such as the self-employed or gig workers, and that’s called Pandemic Unemployment Assistance (PUA) which gives benefits for up to 39 weeks through December 31.

The point is, at the end of the year, both the PEUC and the PUA will be gone, and state UI benefits are going to start tapering off. It’s an income cliff followed by an income slide. It’s a disaster in the making. Oh yeah, and moratoriums on evictions and utilities shut-offs are ending as well. Really? It’s awfully cold recently. Nonetheless, it seems like Congress will not provide another round of income support until January of 2021. I’m not a fan of more government spending, but people need help, and Congress should act.

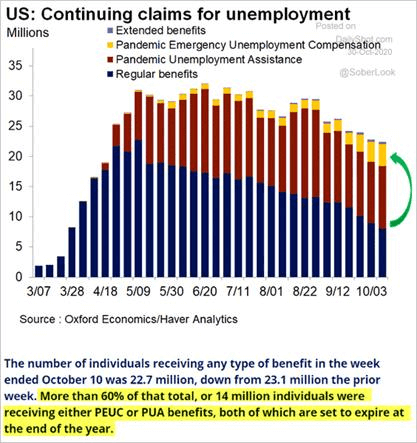
The WSJ had a nice chart that someone else already made up which helps explain the situation:

“This chart shows the total number of people receiving jobless benefits. Below the chart is a comment from Nancy Vanden Houten (Oxford Economics). This year-end income cliff is one of the key reasons economists would like to see another stimulus bill.”

In the meantime, we still have 11 million people who had jobs in February but now don’t. The October employment report comes out Friday, November 6, and is expected to show yet another month of slowing gains. You might note that the last chart looks very similar to the first charts showing growth rates of income and consumption.

So let’s review. 

  • Consumers got a huge income boost from the CARES Act, but saved a lot of it, and did not spend it.
  • They are still saving about twice as much income as they normally would, even as income drops off - unemployment Insurance benefits in most forms are dropping off a cliff at the end of the year.
  • Employment growth is slowing.
  • COVID-19 is rising.
  • As I noted previously, this is an unhappy combination for Q4, and I am sorry to say it. Review my economic analysis for Q3 2020.
useful description of image if informative and not decoration only.
You can also call an expert at 410-316-6164
We're always producing new content to help businesses understand economic trends and navigate trade uncertainty.
Sign up for our newsletters to make sure you don't miss anything.