It’s not just the employment report – there’s a lot more to tie together here, and overall, it’s looking better and better.
Employment
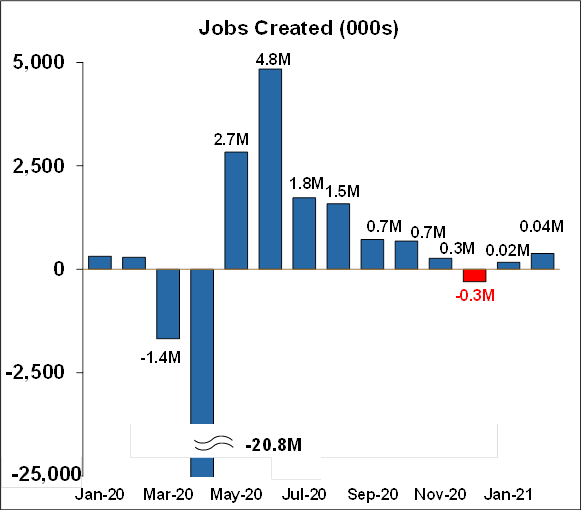
As previously noted, the March 5 U.S. employment report for February showed a strengthening economy. It was the best report in five months:
- The economy created 379,000 jobs, much higher than expectations of 150,000-200,000.
- January’s 49,000 gain was revised up to 166,000. However total revisions for January and December were up only 38,000.
- We have now (March 2021) recovered 58% of all the jobs lost last March and April. But there are still 9.5 million people who had a job last February who don’t now (March 2021). We have a way to go, and we will for at least another year.
- The top-line increase was driven by the battered leisure and hospitality industry (bars and restaurants) which saw sharp job gains of 355,000. States are starting to loosen up dining restrictions, and we can expect quite a bit more of this to come.
- The unemployment rate ticked down from 6.3% to 6.2%, still quite a way to get to the record low 3.5% just before Covid.
- The labor force participation rate remained unchanged, but the employment/population ratio inched up 0.1% to 57.6%.
- Construction lost -61,000 jobs, probably due in part to bad weather.
- Manufacturing gained 21,000 jobs after having lost -14,000 last month.
- Outside of leisure and hospitality, gains were unremarkable.
Overall it’s a good report because it was much better than expected, and it was the best in five months. The labor market is warming up.
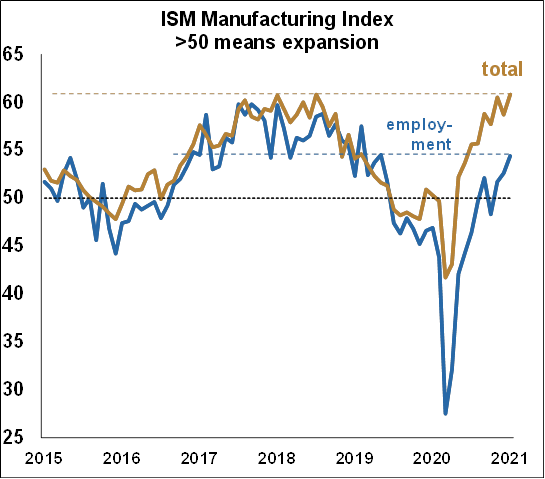
The commentary from the survey is illuminating and paints a picture of vigorous if chaotic growth in the sector:
- “The coronavirus [COVID-19] pandemic is affecting us in terms of getting material to build from local and our overseas third- and fourth-tier suppliers. Suppliers are complaining of [a lack of] available resources [people] for manufacturing, creating major delivery issues.” (Computer & Electronic Products)
- “Supply chains are depleted; inventories up and down the supply chain are empty. Lead times increasing, prices increasing, [and] demand increasing. Deep freeze in the Gulf Coast expected to extend duration of shortages.” (Chemical Products)
- “Steel prices have increased significantly in recent months, driving costs up from our suppliers and on proposals for new work that we are bidding. In addition, the tariffs and anti-dumping fees/penalties incurred by international mills/suppliers are being passed on to us.” (Transportation Equipment)
- “We have experienced a higher rate of delinquent shipments from our ingredient suppliers in the last month. We are still struggling keeping our production lines fully manned. We anticipate a fast and large order surge in the food-service sector as restaurants open back up.” (Food, Beverage & Tobacco Products)
- “Overall capacities are full across our industry. Logistics times are at record times. Continuing to fight through shipping and increased lead times on both raw materials and finished goods due to the pandemic.” (Fabricated Metal Products)
- “Prices are going up, and lead times are growing longer by the day. While business and backlog remain strong, the supply chain is going to be stretched very [thin] to keep up.” (Machinery)
- “Things are now out of control. Everything is a mess, and we are seeing wide-scale shortages.” (Electrical Equipment, Appliances & Components)
- “Labor shortages at suppliers are affecting material deliveries and prices.” (Plastics & Rubber Products)
- “We have seen our new-order log increase by 40 percent over the last two months. We are overloaded with orders and do not have the personnel to get product out the door on schedule.” (Primary Metals)
- “A sense of urgency is being felt regarding new orders. Customers are giving an impression that a presence of stability is forthcoming and order flow is increasing.” (Textile Mills)
- “Prices are rising so rapidly that many are wondering if [the situation] is sustainable. Shortages have the industry concerned for supply going forward, at least deep into the second quarter.” (Wood Products)
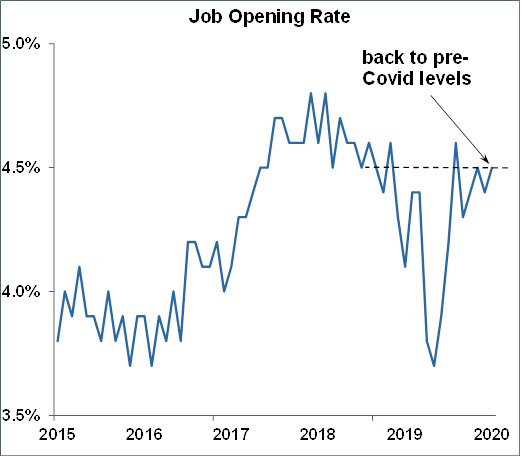
A separate government survey confirmed that indeed, employers have plenty of job openings:
There’s a lot of money out there from stimulus programs… do we need more?
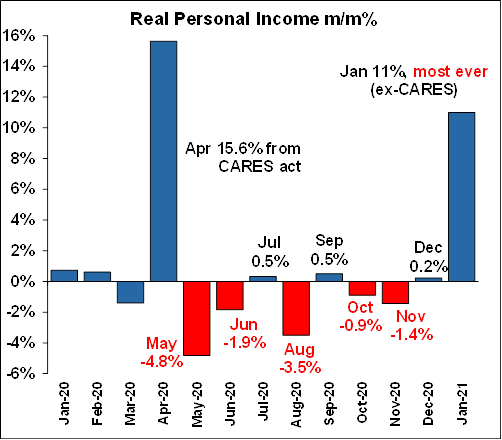
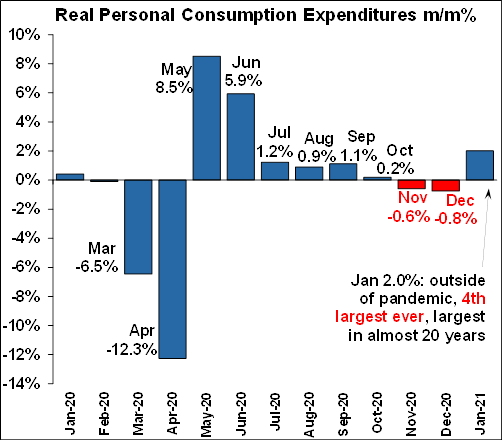
While I was out last week, the government issued its report on Personal Income and Personal Consumption Expenditures (PCE). Since PCE drives 70% of the economy, I think it is the second most important report after the employment report and is a bit overlooked. In any event, the report clearly showed the effects of the $900B stimulus package passed in December. Personal income rose a staggering 11% month/month. Except for the 15.6% from the CARES act, it was the largest monthly increase ever (62 years) by a long way – the previous record was 5.8%. That increase of course boosted personal consumption by 2.0% month/month. That may not sound like a lot but outside of the recovery months of last May and June, it was the fourth-largest ever, and the largest since the month after 9/11 – almost 20 years ago. But it wasn’t nearly as massive as the growth in income.
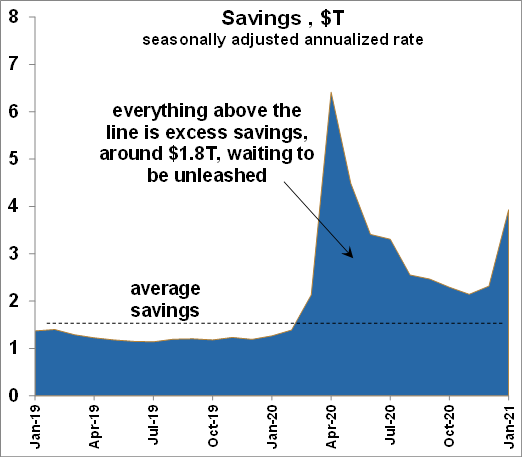
Well, if consumers didn’t spend all of that income, of course, it went into savings, and at the moment the consumer has about $1.8T of excess savings just waiting for the right conditions to blast it into the economy. In fact, we might have seen some of that already in the January retail sales which rose a huge 5.3%, the third-largest ever outside of the pandemic months.
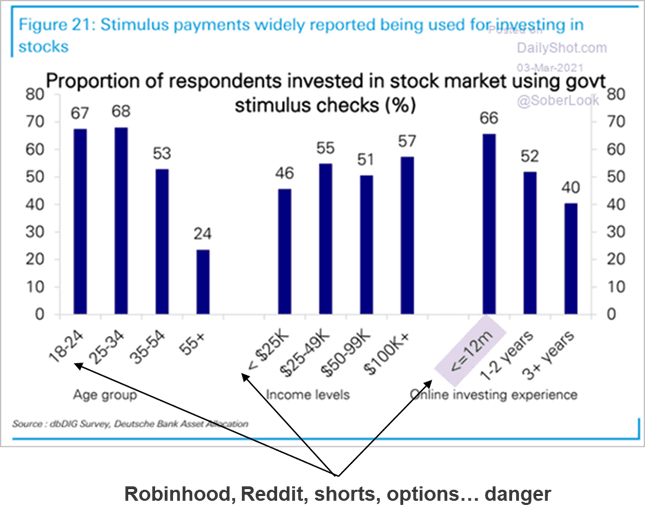
But consumers have also done something less noble with all that stimulus money. They’ve actually bet it in the stock market. And they bet it, they didn’t invest it. You can see it in the chart below from a Deutsche Bank survey. The numbers are truly staggering. The first column says that of the respondents to this survey who are in the 18-24 year old age bracket, 67% of them “invested” their government stimulus checks in the stock market. Even in the lowest income bracket, 46% of respondents put those checks into the stock market. And among respondents who have investing experience of less than or equal to 12 months, fully 66% used their checks in the stock market. To me, this chart verges on shocking. And don’t forget, they’re betting your money. Stimulus money has to come from somewhere, and it’s either taxes now or taxes later.
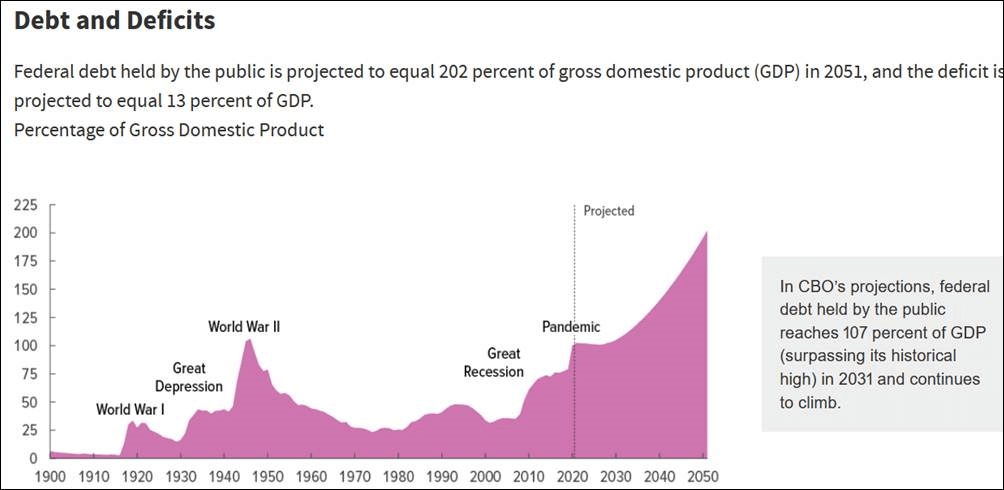
So do we really need another $1.9T of stimulus right now? The economy is looking better and better, and most of the stimulus money already issued hasn’t even been used yet – it’s been saved or bet. And of course all of that stimulus money is raising the debt. On Thursday the Congressional Budget Office (CBO) issued a projection of the debt/GDP ratio going out to 2051, and really, it’s almost comical. CBO says that unless something changes, the debt/GDP ratio will climb to an astronomical, unthinkable, outrageous 202%. By comparison, in the period from 1962 to the financial crisis, the debt/GDP ratio averaged only 32%. And this doesn’t even include the proposed $1.9T stimulus program. How did this happen? Stimulus programs are part of it. But the mandatory entitlement programs of Medicare, Social Security, and Welfare, which take up two-thirds of budget outlays, are expanding because we are getting older, sicker people in the population and fewer younger workers to pay into those programs. Those programs can’t be touched politically. Solution? More skilled legal immigrants to pay into those systems, tax increases, means testing, pushing the retirement age out, and several others. It can be fixed, but there is no political will to do it.
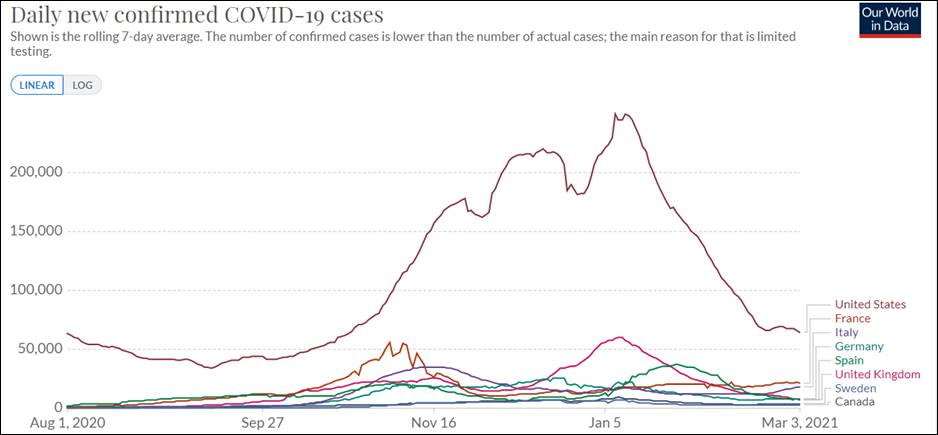
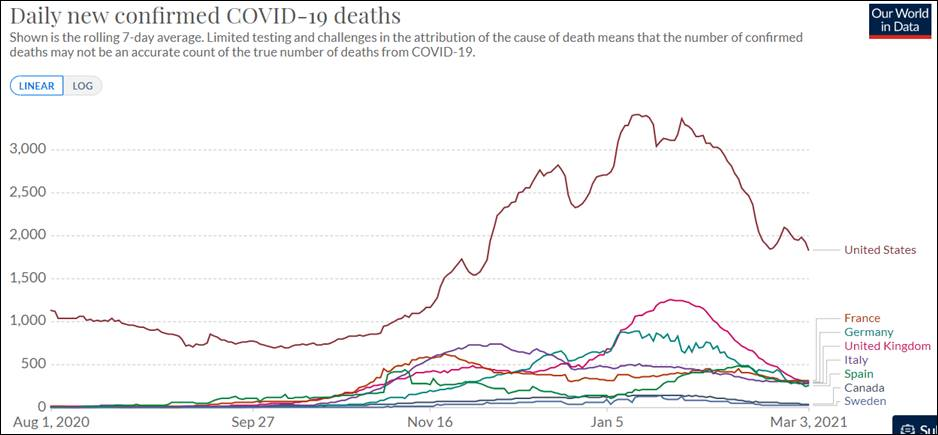
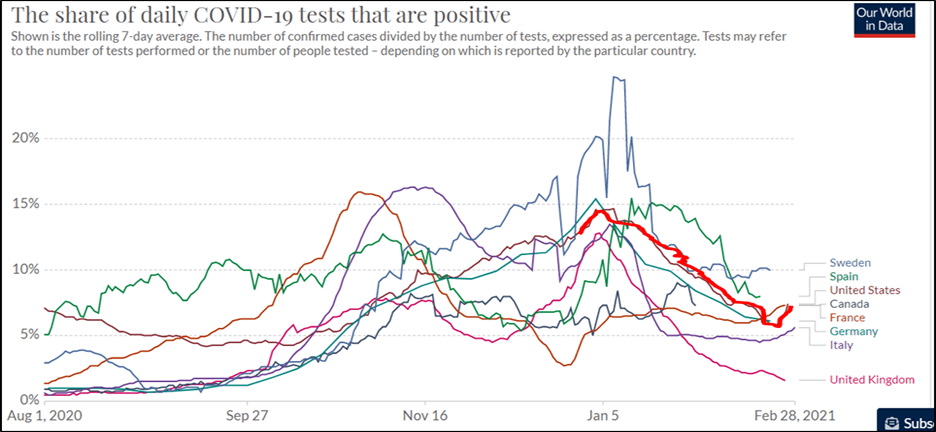
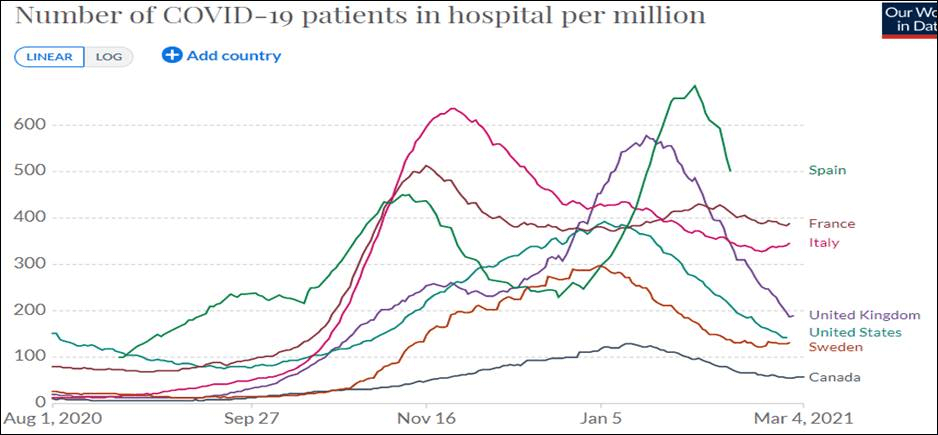
Covid
Here are the latest Covid data from March 4th. The situation is quickly getting better.
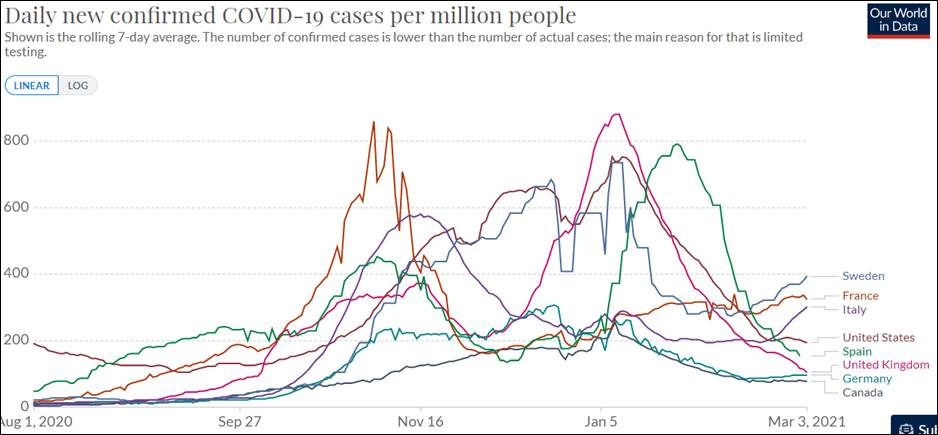
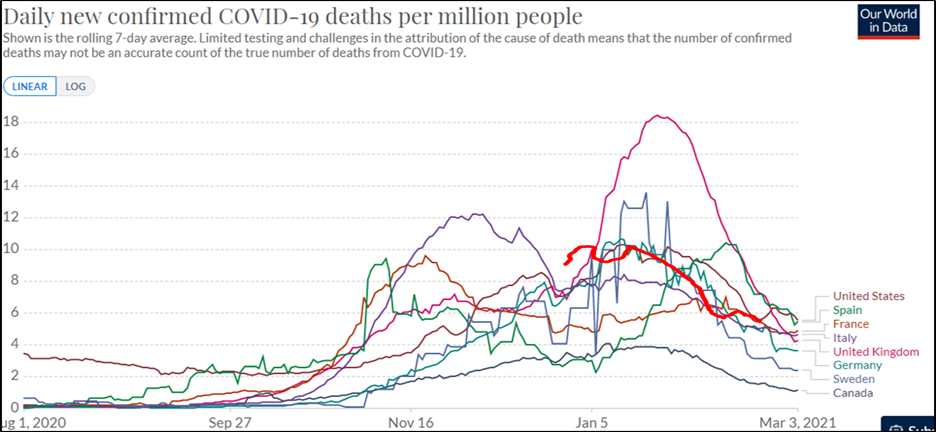
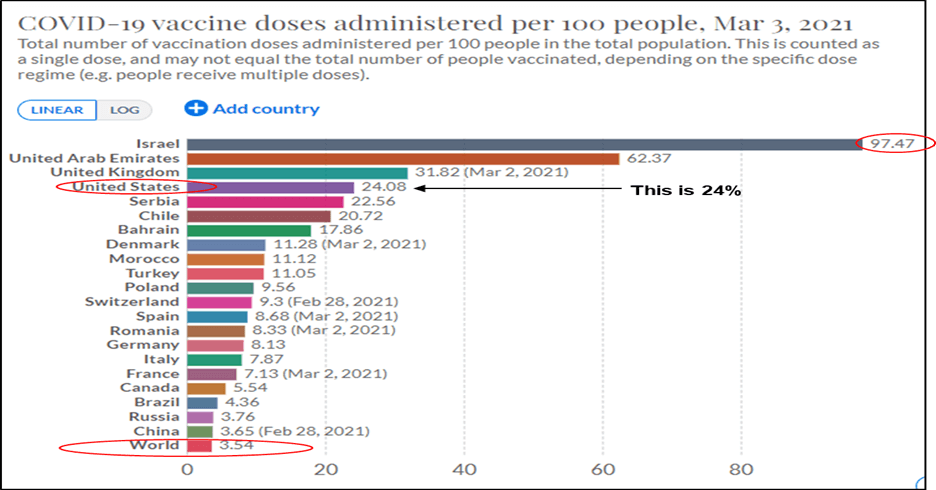
And per million we are 3rd largest major economy – not one of the worst, one of the best.
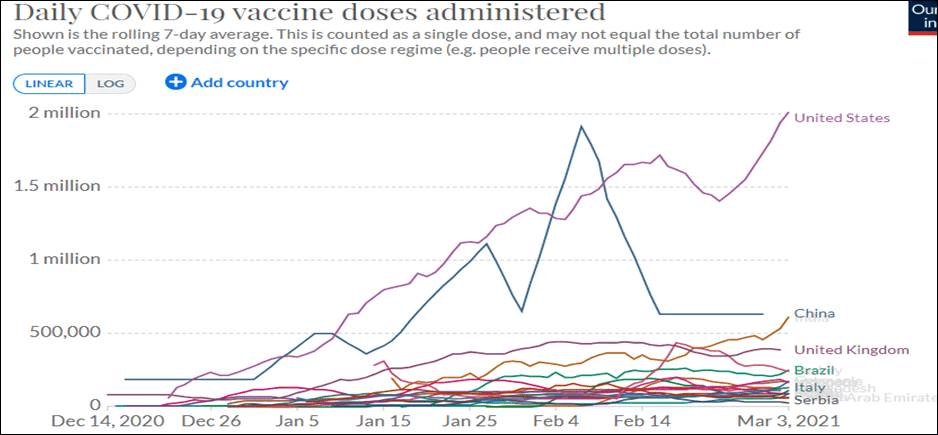
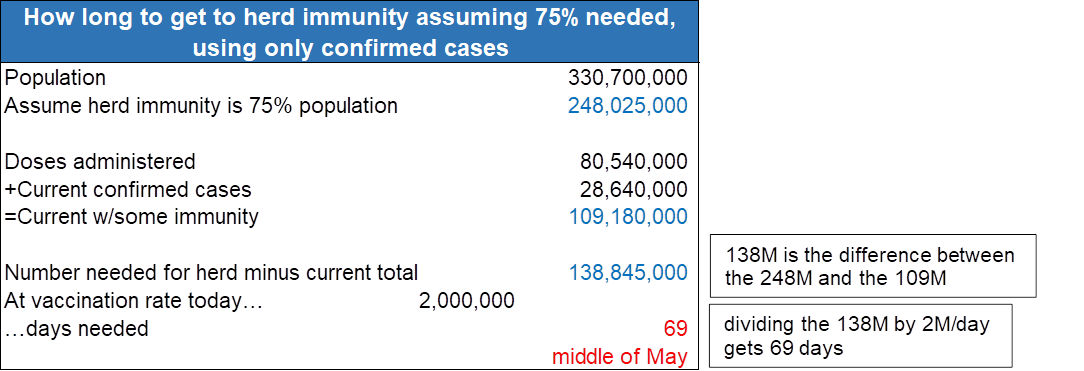
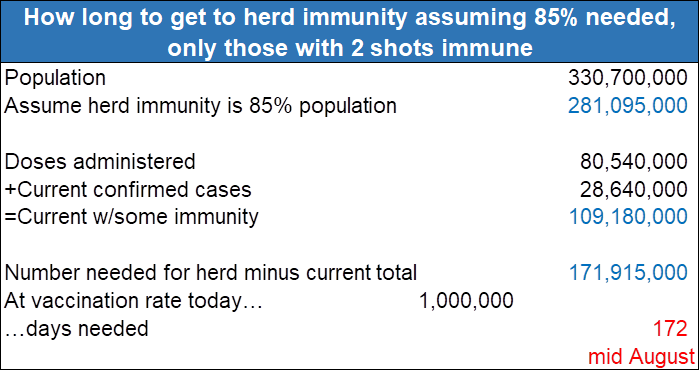
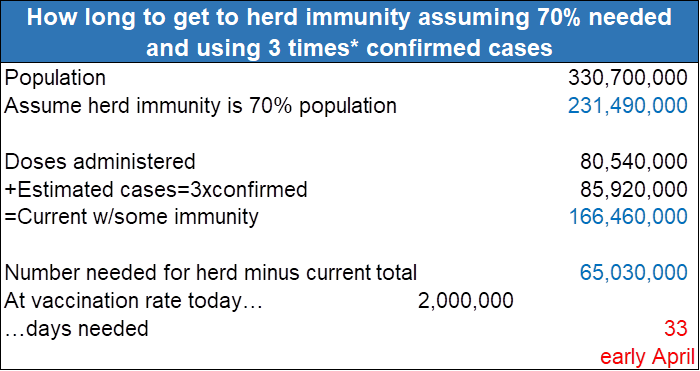
So how long until herd immunity?
These calculations are not forecasts – I don’t have the qualifications or hubris to do that. Rather they are meant to show what could happen under different assumptions. All these scenarios assume that we continue administering vaccines at 2 million per day and that we have enough supplies.
*There are more cases than "confirmed" cases. Some models suggest 2-6 times as many
One might conclude that it is possible we could have herd immunity sometime this summer. By the way, there was an opinion piece in the Wall Street Journal two weeks ago by a Johns Hopkins surgeon who suggested we would have herd immunity by April. It’s an interesting read. Some commentators skewered him, some praised him – take your pick.
The economy is rapidly improving. Go back up to the charts on job gains, personal income, and personal spending. Before this most recent data, all those charts were going the wrong way. States are easing restrictions so bars and restaurants are coming back online, and that will only continue. Manufacturing is hot – so hot that it is short of employees. There are plenty of job openings. Excess savings, a rapidly improving Covid situation, and the approach of warmer weather make for a brighter outlook than a month ago in February.