U.S. Employment Report Full of Contradictions

Dan North | December 6, 2021

The November employment report was full of maddening contradictions. One economist called it “one of the most confounding that I have ever seen.” Another bluntly said, “I don’t believe these top-line numbers” (as in, they weren’t credible).

The mixed headline numbers were:

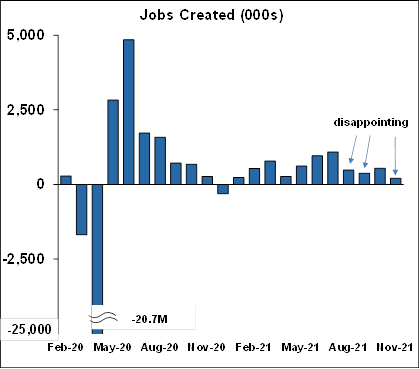
  •         Non-farm payrolls grew by 210,000 jobs, far below expectations of 550,000.
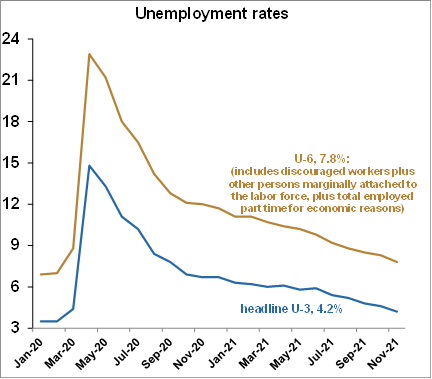
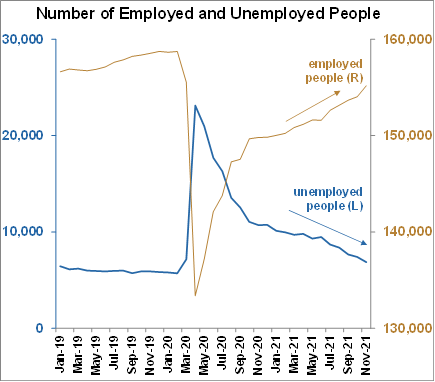
  •         But the unemployment rate fell sharply from 4.6% to 4.2%.

To explain the difference we have to get down into the weeds of the report just a little bit. The report is actually made from two separate surveys, the “establishment” survey, and the “household” survey. The establishment survey produces the non-farm payrolls number, while the household survey produces the unemployment rate.

Generally speaking, the establishment survey is considered to be more reliable because it uses a much larger sample of about 144,000 businesses, capturing around one-third of all non-farm payroll jobs. The household survey uses a much smaller sample of only 60,000 households. There are many other differences between the two which we will discuss below.

The establishment survey represented the weak half of the report with disappointing job growth as mentioned. It was the third disappointment in four months. The same survey is used to calculate wages or average hourly earnings. 
wages - sept2021
Wages are growing at a record high rate (outside of pandemic swings) of 4.8% y/y. By comparison over the previous 12 year period, hourly wages grew at only a 2.5% rate y/y, about half the current rate. This data can be viewed as both positive and negative. It’s great that workers are getting higher wages, and yet it’s not enough to keep up with consumer inflation which is now running at 6.2% y/y, the highest in 30 years. Another downside is that higher wages are likely to contribute to higher inflation.
nfibsurvey - sept2021
By contrast, the household survey provided a substantially brighter outlook. First, the headline unemployment rate (U-3) fell sharply from 4.6% to 4.2%. Another measure which some call the “real” unemployment rate, the U-6, which includes discouraged workers, other persons marginally attached to the labor force, and those employed part-time for economic reasons, fell even more sharply from 8.3% to 7.8%. 
job openings-sept2021
Often the unemployment rate falls for the wrong reason, which is when the labor force shrinks (meaning there are fewer people counted as “unemployed”). Not in November. In November, the labor force grew instead, driving the accompanying labor force participation rate up 0.2% to the highest level since the pandemic. The combination of a falling unemployment rate and a rising participation rate is double good news.
job openings-sept2021
There was even more good news in the household survey, showing that the number of unemployed people fell by 542,000. In addition, the number of employed people rose by 1,136,000, and that is where the major rub lies—that number was far, far different than the establishment survey’s 210,000.
job openings-sept2021

So let’s return to the differences between the two reports, of which there are many. One of the most significant differences is that the household report includes the self-employed, unpaid family workers, and private household workers—the establishment survey does not.

This difference with the data leads to a theory that might clear up some of the mysteries in the labor market in general. We know that the number of job openings compared to the number of hires is just off of a record high, so employers are desperate for workers. But at the same time, the number of people quitting their jobs hit a record high of 4.4 million recently. 

covid lists - sept2021

So where did these quitters go when so many jobs are available? The key could be that as mentioned above, the household survey includes self-employed people, an amount which is growing. It could be that quitters are joining the ranks of the self-employed.

In fact, if we go back to the jobs recovery starting in May 2020, and compare the number of people who quit to the number of people who became self-employed, they are very close indeed (quits are reported two months after the employment report, that’s why the red line in the second chart stops short). 

continuing jobless claims - sept2021

There are several reasons why people would become self-employed: they’ve seen they can do a job from home, so they can become consultants, or day-traders (good luck), or sell goods on the internet, or they may still have a fear of Covid and just try to make money out of the house somehow. And again they are not in the establishment report which was so disappointing compared to this data.

Jobless claims also support this theory. Initial claims and continuing claims are now at the lowest level since the pandemic. If people are quitting their jobs and they are not claiming unemployment insurance, then a substantial portion of the quitters must have a job… a self-employed job, again not showing up in the non-farm payrolls count of the establishment survey.

continuing jobless claims - sept2021
Admittedly, it’s a theory and it is hard to prove, but it fits the data and it makes sense.
On another topic, high-frequency indicators have been distorted by Thanksgiving and Black Friday, and are currently very noisy, yet a reasonably strong trend remains. Note the spike in JP Morgan / Chase’s credit card tracker.
covid lists - sept2021
Distortions also show up in TSA throughput and OpenTable seatings.
covid lists - sept2021
Hotel performance appears weak on the surface, but apparently, that’s the pattern around Thanksgiving. From STR which measures hotel performance: “U.S. hotel performance came in higher than any other Thanksgiving week on record…”
continuing jobless claims - sept2021

Some are suggesting that supply chain congestion is starting to ease. Really?

According to this data, the number of container ships sitting off of L.A. and Long Beach is higher than ever, as is the waiting time to unload.

JP Morgan - sept2021
And the Institute of Supply Management (ISM) surveys still show severe bottlenecks resulting in very slow delivery times and ever-rising prices.
vaccinated people - sept2021
Once again the anecdotal commentary highlights the situation.

From the services survey:

  •   Labor shortages, transportation delays and supply constraints/allocations.”
  •   Supply chain issues persist,
  •  " …contracts on have been unavailable. Substitutes are always higher in cost.”
  •   shortages and longer lead times… Significant cost increases from labor and freight are forecast for the start of next year.”
  •   multiple shortages on everything from personal protective equipment (PPE) to computers and peripherals, and vehicles. Shipments are taking longer and prices continue to climb,
  •   inflationary forces in the marketplace… suppliers raising their prices moving into 2022.”
  •   Supplies continue to be difficult to obtain at times.”
  •   “Suppliers continue to report that labor shortages are leading to production issues and delays. Continued inflationary pressures driven by the cost of fuel, shipping capacity constraints
  •   “Late deliveries and shortages continue. Disruptions seem to be declining somewhat, as suppliers and customers are finding innovative ways to keep supplies moving
  •   “Continuing struggle with transportation capacity.”
  •  inventory shortages, driver and maintenance worker shortages, and long lead times …This limits our ability to keep vehicles on the road
  •   “Inflation and supply chain issues… cost increases and stockouts

Commentary from the manufacturing survey suggests that the only sector getting better is plastics:

  •  component shortages continue to cause delays in completing customer orders. Backlog continues to increase.”
  •   “Petrochemical supply chain is slowly showing signs of improvement after multiple weather disruptions in 2021.”
  •   “Large volume drops due to chip shortage.”
  •   “All input costs are going up considerably, across the board.”
  •   ".., the biggest challenge we have at the moment is finding qualified workers.”
  •   "…shortages with various metals. Plastic resins seem to be slowly improving. Electronic component lead times are still moving out.”
  •   “Business is strong but meeting customer demand is difficult due to a shortage of raw materials and labor.” [Furniture & Related Products]
  •   …significant supply chain disruptions, which are resulting in historically long lead times… Commodity-based inflationary pressures are widespread
  •   “We are starting to catch a break in plastic resins… Starting to notice improvement in availability/lead time as well.”
Here are cases per million. It looks like the lockdown in Austria is working. It also illustrates the risk. Note that in the U.S. cases are going straight up just like they did in Europe. It seems unlikely that we will get lockdowns, but it would damage the economy if we did.
vaccinated doses- sept2021
Deaths per million—even more vertical than cases in the U.S.
vaccinated doses- sept2021
Hospitalizations per million, a sharp increase in Austria, not so much in the U.S., but again the point is, if it can happen there, it could happen here too.
vaccinated doses- sept2021
Finally here is the reproductive rate, which when it’s below 1, the disease will stop spreading. Of all the data, it may be the most frustrating, going from hope to disappointment and back, over and over again. The U.S. is well above 1 now— a few days ago (late November) it was below 1. Note that in Austria it has fallen below 1, again perhaps illustrating the effectiveness of lockdowns. 
vaccinated doses- sept2021

So part of the employment report was very strong, but it contradicted the other part of the report. However this contradiction may help explain the disconnect between openings, hiring, and quits, and it shows that the labor market may be even stronger than previously thought. High-frequency data has been distorted by holiday spending but still shows an upward trend. The supply chain is still tight, creating inflationary pressures just like wages are.

And as always, keep an eye on Covid. Remember that despite some of the mixed news here, the labor market is strong, as is demand for goods and services throughout the economy, and we still expect next year to be another one of above-average growth.

We're always producing new content to help businesses understand economic trends and navigate trade uncertainty.
Sign up for our newsletters to make sure you don't miss anything.