Employment Report "It’s Like Déjà Vu All Over Again"

Dan North | January 10, 2022

There was an American baseball player named Yogi Berra who was famous for his witty statements which were either self-contradictory or redundant. One of them was “It’s like déjà vu all over again.” That’s the case with the December employment report compared to the November report in many ways.

The two surveys which make up the report were strongly contradictory, again, which is rather unusual. The Establishment survey was much weaker than expected while the Household survey was much stronger than expected— just like in November.

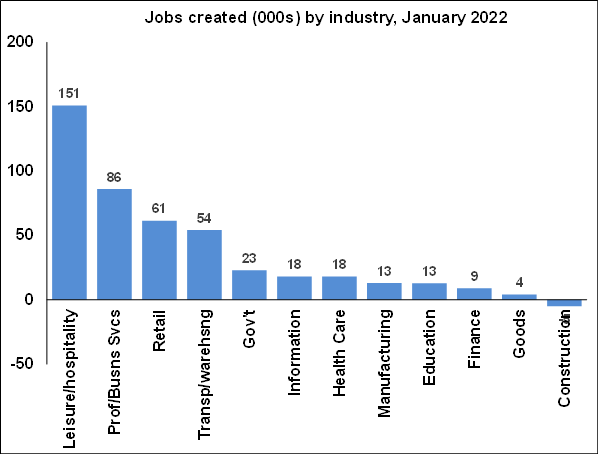
The Establishment survey badly disappointed, just like in November.

  • December Non-farm payrolls grew by only 199k vs. expectations of around 440k, or less than half as much, just like in November.
  • December was the fourth disappointment in five months.

However, the Household survey was stronger than expected, just like in November. Almost all of the important measures moved in the same way qualitatively in both months.

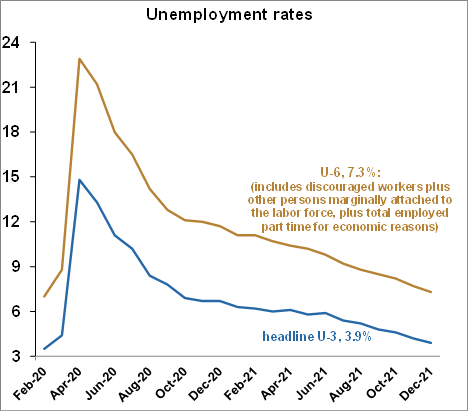
  • There was a sharp drop in the unemployment rate from 4.2% to 3.9%, easily beating expectations of only moving to 4.1%.
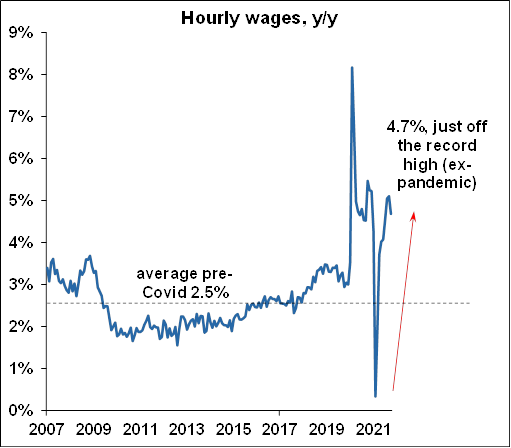
  • Wages rose 0.6% m/m, doubling expectations of only 0.3%. The y/y beat was even bigger at 4.7% vs. expectations of 4.2%.
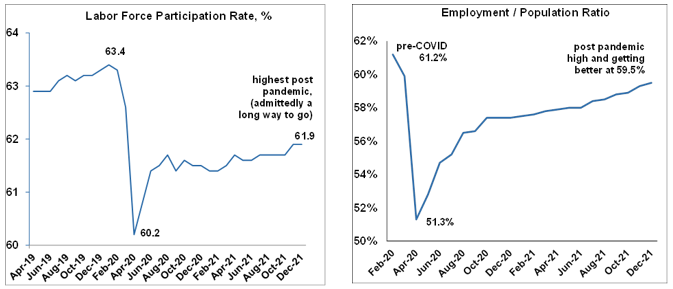
  • The labor force participation rate was revised up over prior months, putting it at 61.9%, a post-pandemic high.
  • The number of employed people rose by 651k, more than three times the size of the Establishment survey’s gain of only 199k.

How can there be such a disconnect? Well, like the two reports, the theoretical explanation is like… déjà vu all over again.

  • Simply put, the Household survey includes self-employed people but the Establishment survey does not. More people are becoming self-employed from a combination of being able to work from home, a tight labor market, and a strong economy.
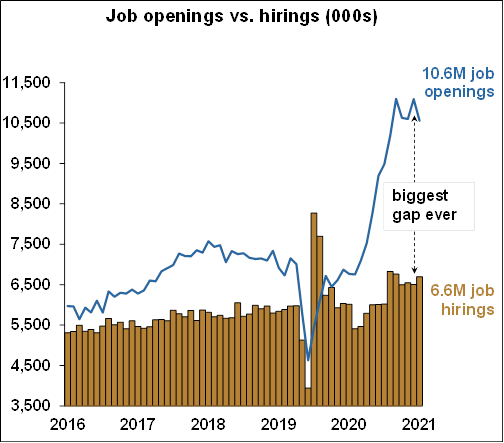
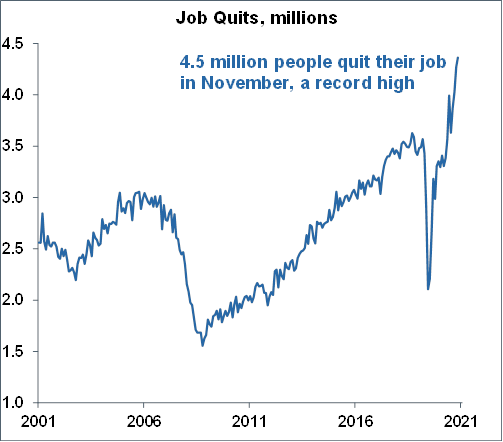
  • The record-high number of quits supports the case—more people are quitting, and while some are switching jobs, some portion is also becoming self-employed.
Here are some of the other standard details from the report. Job gains across industries were mostly positive but tepid. 
wages - sept2021
The economy has recovered 84% of the jobs lost in March and April of 2020. Transportation and Warehousing have recovered, and then some, at 138%, likely due to fulfillment centers.
nfibsurvey - sept2021
Unemployment, labor force participation, and employment/population rates are all improving.
job openings-sept2021
covid lists - sept2021
As mentioned above wages are growing rapidly, driven by a shortage of labor. Those shortages show up in the enormous gap between job openings and hirings, just off a record set last month. The level of quits continues to hit new records, as an astonishing 4.5 million people quit their jobs last month.
covid lists - sept2021

The Institute for Supply Management’s (ISM) surveys on Manufacturing and Services both showed some changes this month, but the data requires careful interpretation. Keep in mind that in the ISM surveys, 50 is the dividing line between better/worse, or slower/faster, or less/more. One might get the impression looking at the first chart that since the lines are going down delivery times are improving. But the levels of the lines are still above 50, and that means that delivery times are actually still getting worse. The fact that they are turning down, just means that delivery times are getting worse at a slower rate than last month. For instance, say in November a participant might have said that delivery times got longer by 5 days. In December they might have said that delivery times got longer by 2 days. Delivery times are still increasing, just not as fast as before.

It’s the same in the other charts.  For instance, on the second chart showing prices, even though the manufacturing line is going down, it is still above 50, meaning that prices are still rising, just not as fast as before.  Note in services, it’s the second-highest reading on prices ever in 25 years of records, at a blistering 82.5. Remember, services drive around 85% of the economy. Obviously, and everyone knows it, these costs are getting passed on to consumers. Demand remains very strong both in manufacturing and services with new orders and backorders increasing.

covid lists - sept2021

Comments from the ISM participants focus on the same problems as always: supply chain delays, shortages of materials, continued difficulty getting and keeping labor, and rising costs all up and down the chain. There are some comments that supply chain issues are easing and that seems to be true in chemicals and plastics, but it’s not economy-wide as shown in the charts above.

By the way as of January 6th, there were still 49 ships anchored off the ports of LA and Long Beach. That’s an improvement from around 70 in late December, right?  But keep in mind that normally zero ships are waiting at anchor, not 49. And when you add in the number of ships at berth to be unloaded, the total on January 6th was 102 – in December it was 120.  Come on. Supply chain problems are here for a while.

You may recall that after the most recent Fed meeting on December 15th, it issued a statement indicating there would be three interest rate hikes in 2022 and that the tapering of bond purchases would end sooner than previously expected. The minutes of that meeting were released on Wednesday, and the financial markets acted as they had never heard of such an outrageous thing. The Dow lost 400 points and Treasury yields rose. The financial markets can be driven by sentiment, and after reading the dreary minutes, even though they had no substantive new information, sentiment turned sour.

The Fed is hiking rates because of inflation (see the ISM number above but wear sunglasses). Interest rates rise with inflation. Here’s the 30-year mortgage rate, and it’s going to start shutting people out of the housing market. Inflation hits in other places, not just daily consumption.

continuing jobless claims - sept2021

The Atlanta Fed has a GDP Now model which takes the economic data we have so far and calculates what GDP should be next quarter. Right now it is showing that GDP growth in Q4-21 should be a raging 6.7%. Who cares? That’s already happened. GDP is backward-looking into October, November, and December (OK I’m being a little facetious here because GDP does matter and it does provide historical context). But the problem with most government data is that it is usually produced with a lag of a month, even longer with GDP.

That’s why high-frequency indicators are so helpful. They suggest that Omicron may be making a slight dent in the economy with more mask and vaccine mandates.

covid lists - sept2021
The most recent Covid numbers from January 6th show just how contagious the Omicron variant is, with cases going vertical, the reproductive rate high, and hospitalizations unfortunately near records. However, Omicron does seem to be less deadly. For the first time, Canada is showing up on some of the charts. But as far as vaccinations go, Canada is a model, and the U.S. is not. Vaccinations have absolutely stalled in the U.S. – have we gotten all the people we are going to get?
covid lists - sept2021
Omicron is a risk and may be crimping the economy. But the labor market is strong despite a severe shortage of workers. Prices are rising. The supply chain is still jammed. But overall demand in the economy is terrific.
We're always producing new content to help businesses understand economic trends and navigate trade uncertainty.
Sign up for our newsletters to make sure you don't miss anything.