
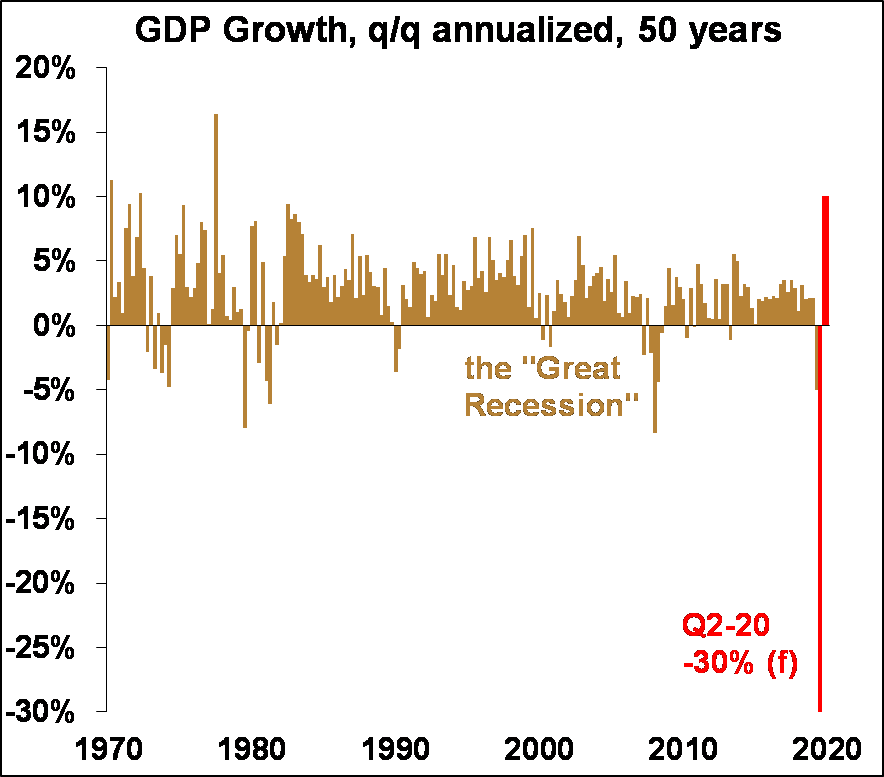
The first revision to Q1 GDP slipped from -4.8% q/q annualized to -5.0%, the worst since 2008 in the Great Recession. After that, we have to go back 38 years to find a quarter this bad. The revision was mostly due to an update of inventories. Of course, for Q2 we still maintain a drop of -30% followed by a sharp rebound in Q3 and Q4.

More Records, But We May be Starting to Bottom Out
Dan North | June 1, 2020
Personal Consumption
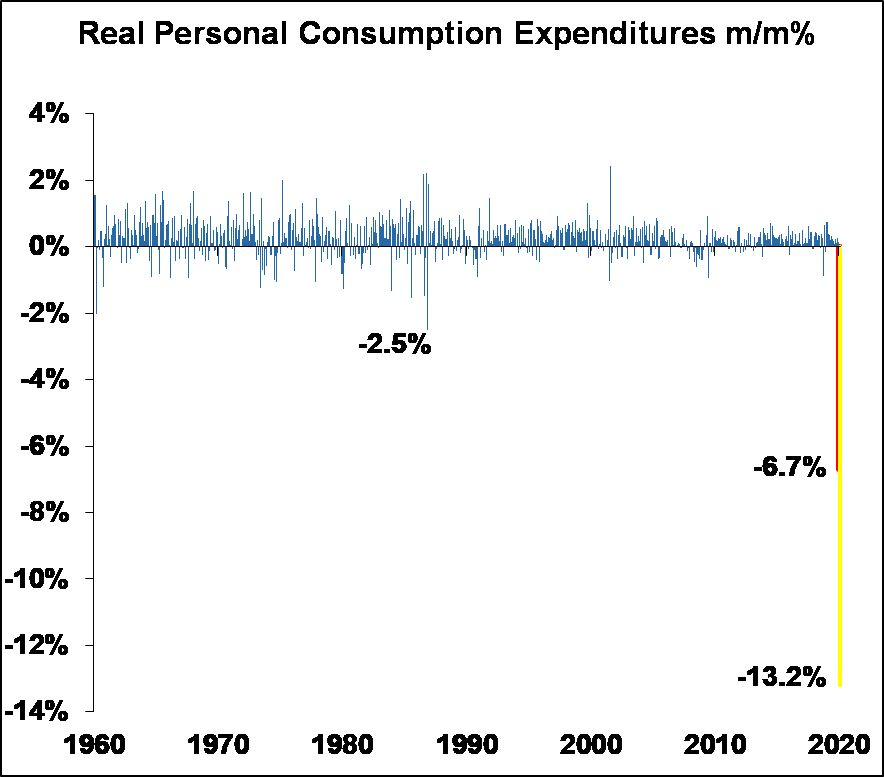
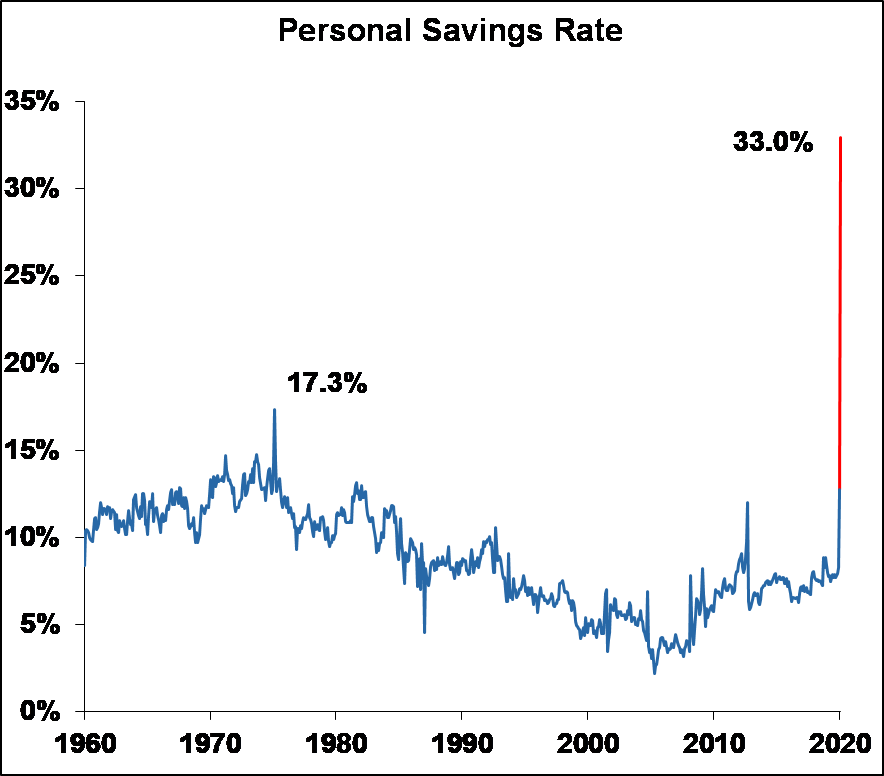
Real personal consumption expenditures (PCE), which drive 70% of all economic activity, fell in April by an amount which would have previously been unthinkable: -13.2% m/m. The prior record was set last month but was a plummet of only -6.7%. More importantly, in the 60 years of data, the worst monthly decline before the last two was only -2.5%. It’s understandable. People have stopped spending and are now saving, which has driven the savings rate up to an astronomical 33%, almost twice the previous record of 17.3%. The good news is that it’s probably the bottom for PCE. Most of the state shutdowns began in the middle of March and ended toward the beginning of May, so April was the only month that was shut down for the entire period. It’s quite likely that since most states started to re-open in the beginning to the middle of May, that PCE in May will easily exceed that of April.
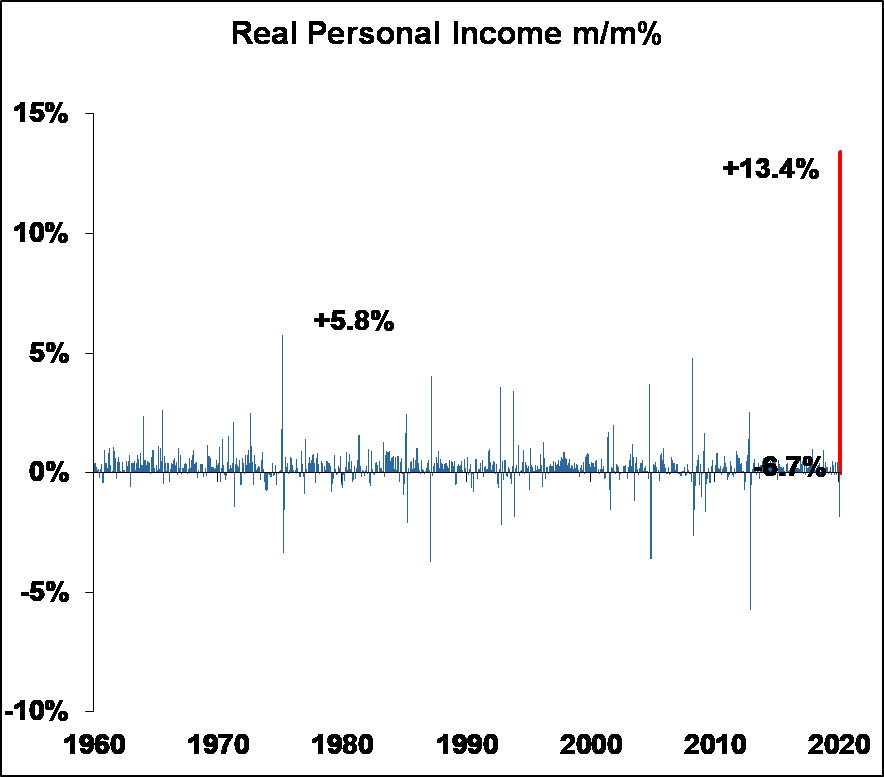
In welcome contrast, real, after-tax personal income skyrocketed by +13.4% m/m (previous record +5.8%) despite the massive unemployment. It is true that compensation in the form of wages, salaries, and benefits fell by a daunting -7.7% m/m (previous record -3.8%). But Americans got income from another source: the CARES act! Payments to citizens from the government’s CARES act increased income by $3T annualized, far outstripping the lost wages / salaries / benefits of only -$879B. The $3T annualized increase amounts to about $1,900 per family, and in aggregate it was certainly more than enough to cover the lost income (for at least one month).
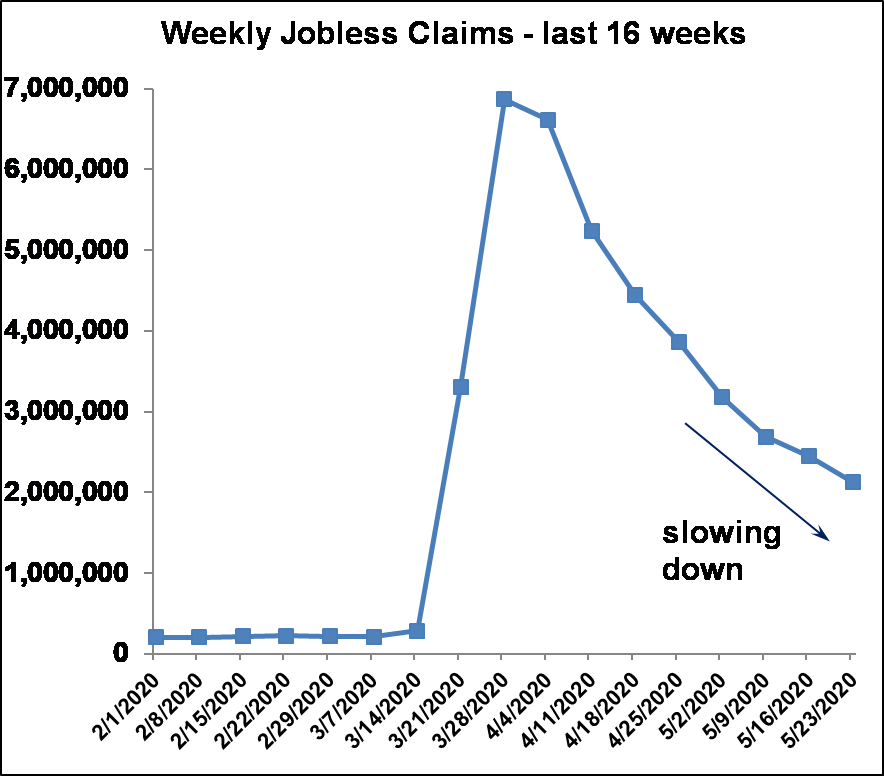
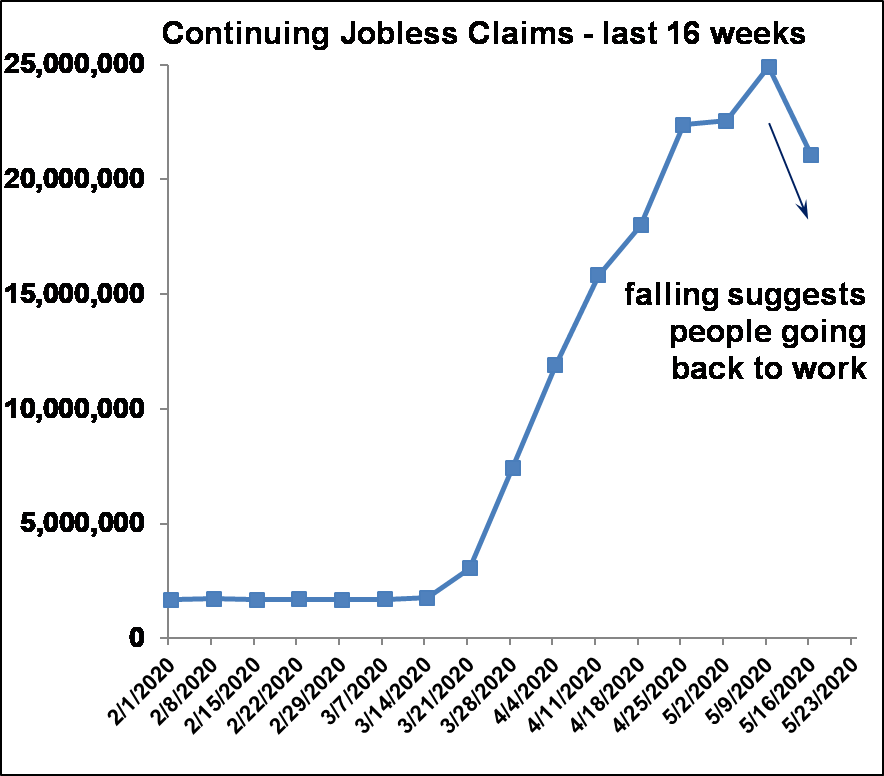
Weekly Jobless Claims
It wouldn’t be a Friday without a mention of weekly initial jobless claims…. Once again they were stratospheric, but they are definitely on the downswing and are quite likely to keep falling. Continuing claims, which count everyone who is still getting benefits (not just those who applied this week), actually fell. This would suggest that people are now getting off the unemployment rolls and actually going back to work (a technicality could distort the numbers over the next few weeks) but we expect the trend to continue. In other words, it’s probably the bottom.
A few more notes on the week:
- Corporate profits fell by-13.9% q/q (not annualized) in Q1-20, the third-worst since the end of WW-II. This is probably not the bottom, and like GDP will suffer a larger fall in Q2 followed by a rebound in Q3 and Q4.
- Durable goods orders fell -17.7% m/m in April, the second-worst ever since records started 28 years ago. “Core orders” for durable goods, which are a proxy for business spending fell -5.8% (amazingly not a record, but in the worst 5%).
- The trade deficit widened 7% in April as exports fell a stunning -25%, six times the previous record. Imports fell -14% vs the previous record of -6%. Global trade is on the ropes; over the past year exports have fallen -30% and imports have fallen -21%.
Housing
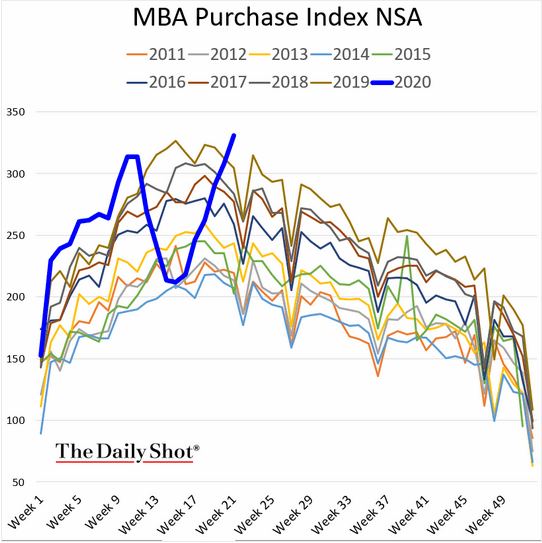
Housing is looking up for several reasons. First, Ian Shepherdson of Pantheon Macroeconomics makes a very good argument, which I will vastly over-simplify: the people that were laid off weren’t going to be buying a home anyway. Second, people want out of the city, plain and simple (our local real estate agents are reporting a surge of Baltimore and Washington people who want to move out to a more rural area about 1.5 hours away from the cities.) Third, homebuilder optimism has rebounded. Fourth, mortgage applications for purchases are now at the highest level in 10 years.
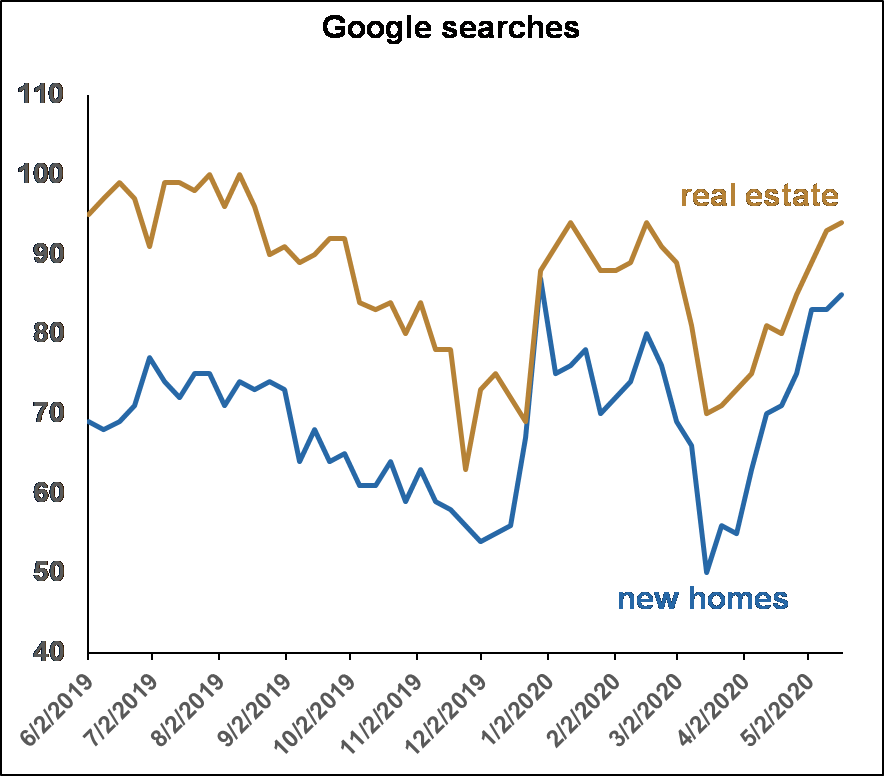
Fifth Google searches for “new homes” and “real estate” are not only rebounding but they have now risen above pre-shutdown levels

Fifth, new home sales in April actually rose, not fell, as would be expected.
Housing isn’t out of the woods yet since pending home sales, which lead existing home sales dropped -22% in April, meaning that May existing home sales will be terrible. But there’s a good chance that will be the bottom.
I’ve pinched some good charts from the Wall Street Journal’s Daily Shot, each of which is showing, again, a bottoming of activity.
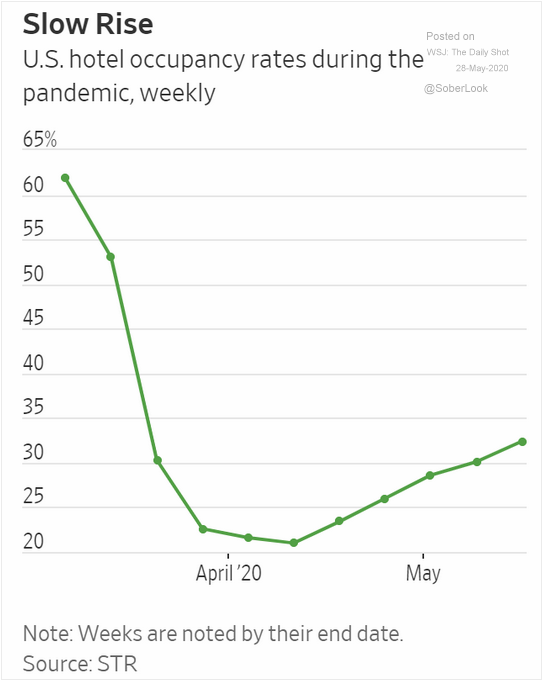
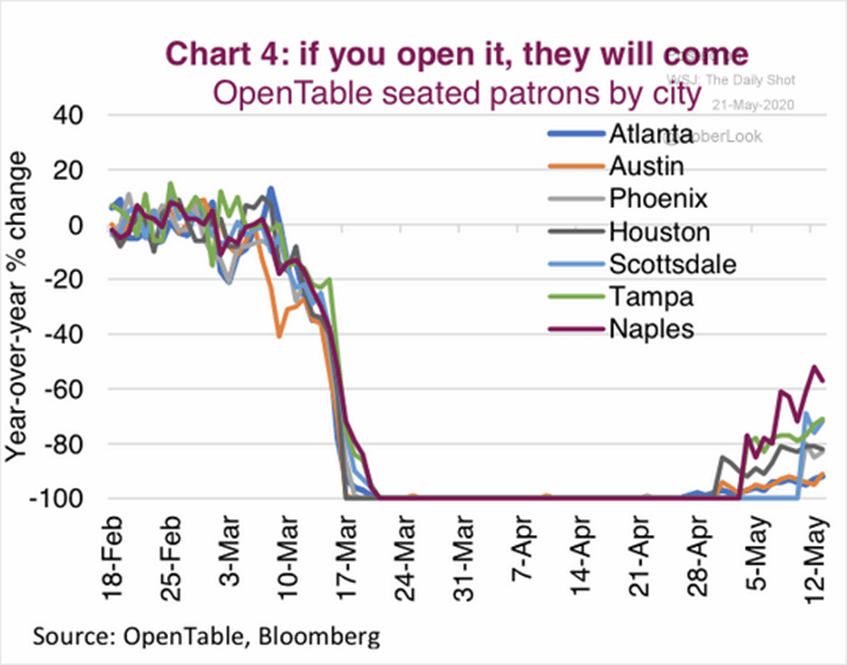
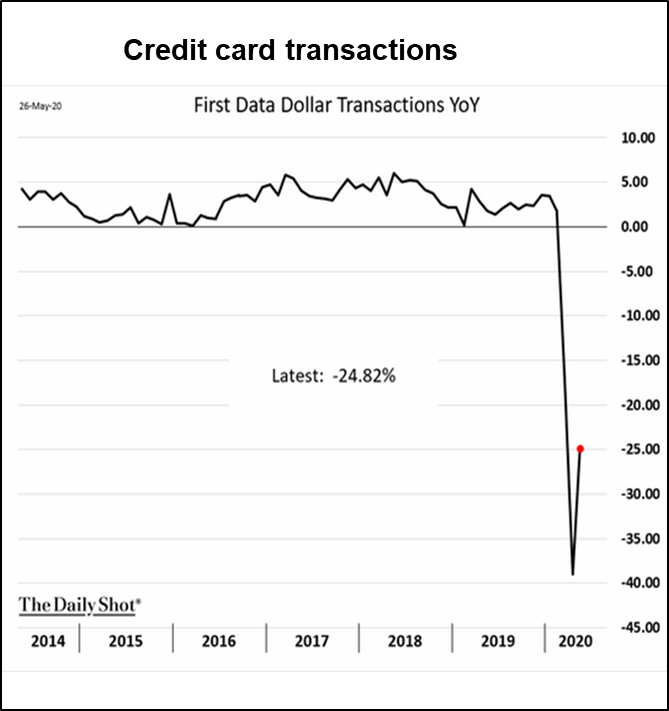
But let’s be clear. A “bottoming” doesn’t mean things are back to normal, it means that they have stopped getting worse. We have a long way to go to get employment back up to acceptable levels and don’t expect to see that recent 50-year low unemployment rate of 3.5% again until a few more business cycles – probably decades. We still have obstacles. Unemployment benefits will keep workers at home for months yet. Child care will be very difficult to find since most summer programs are closed and any concerned parent will worry about where a babysitter might have been. And as seen in the charts above, and several other surveys, while consumers are coming out, they are doing it much more slowly than we would like. But it looks like the bottom.


Get economic & trade content in your inbox
We're always producing new content to help businesses understand economic trends and navigate trade uncertainty.
Sign up for our newsletters to make sure you don't miss anything.
Sign up for our newsletters to make sure you don't miss anything.