US Employment Report: A Major Disappointment

Dan North | September 9, 2021

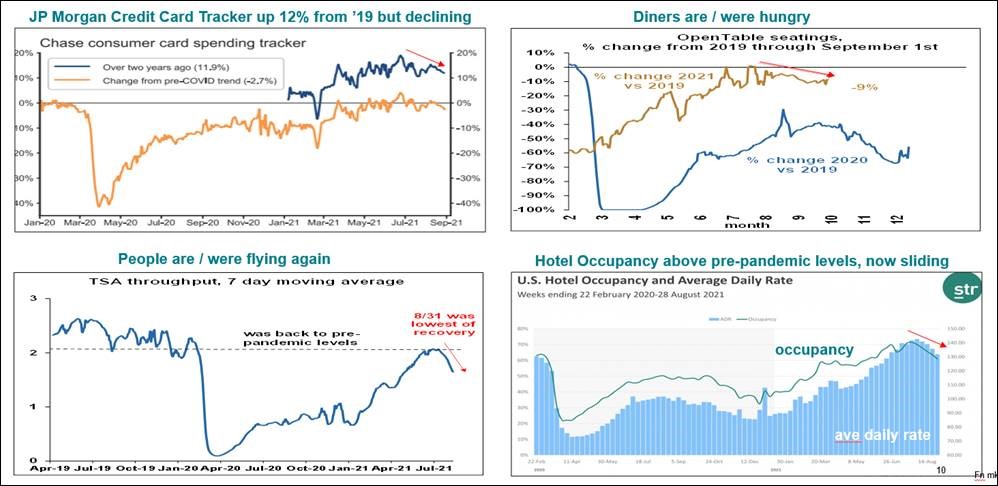
The employment report for August 2021 was a dramatic disappointment. The economy created only 235k jobs vs. expectations of 720k. It was the worst performance of the entire year to date. Leisure and hospitality, which had been driving much of the jobs recovery since the pandemic with an average of 432k per month, came up with 0 job gains in August - none.

Within that category, “accommodation and food services” (hotels) lost -34.9k, and “food services and drinking places” (restaurants and bars) lost -41.5k. In addition, retail lost -28.5k. There was an increase of about 400k in those who said they couldn’t work for pandemic-related reasons, pushing the total up to 5.6 million. The data strongly suggest that the Delta variant of COVID-19 is indeed putting a damper on economic growth.

There were some positives in the report as the prior two months of job gains were revised up a total of +134k, and the unemployment rate dropped from 5.4% to 5.2% as expected. Again, the unemployment rate can’t be taken at face value without looking at the labor force participation rate as well (the percentage of the population either working or actively looking for a job). That was unchanged at 61.7% vs. 63.4% just before the pandemic.

More importantly, outside of the pandemic months, that 61.7% is the lowest in over 43 years. It also means that 3 million fewer people are participating in the labor force than before the pandemic, while at the same time there are 5 million fewer jobs. In other words, there are more jobs to recover with fewer people interested in filling them.

Average hourly earnings (wages) rose +0.6% m/m putting the y/y rate at 4.3%. Outside of the pandemic months, that is the highest in 14 years of records. This faster wage growth is another sign of high demand and low supply of labor, and it’s a significant driver of overall inflation which shows up in other reports below.

wages - sept2021

Indeed, there are several other signs of high demand and low supply of labor and rising prices.

The National Federation of Independent Business (NFIB) survey points to higher wages. The net percentage of respondents who plan to raise wages, and those who already have raised wages, both set record highs last month.

nfibsurvey - sept2021
The Job Openings and Labor Turnover Survey (JOLTS) shows that there were 10 million job openings in June, but there were only 6.7 million hirings. The gap between the two has never been greater.
job openings-sept2021
The number of people still claiming unemployment benefits, another measure of low supply, is still six times the long-term average. But it should be noted that three-quarters of those claims are in the special pandemic programs which are phasing out September 2021. That could boost the supply of labor in the coming months.
continuing jobless claims - sept2021

The Institute of Supply Management (ISM) monthly surveys (first chart) are also showing a deteriorating employment picture. Both the manufacturing and supply surveys were at recent highs but have fallen sharply over the past few months.

In fact, in the manufacturing survey, the employment component is at 49, signaling contraction. The overall indexes (second chart) are falling sharply as well. In the services survey, all 9 components fell, the first time that has happened in 7 years. The price component in the reports has also fallen recently but remains near a historically high level, also signaling inflation. 

The comments from the participants are always revealing and show how pervasive, and almost frantic, their concerns are over lack of labor, supply chain disruptions, COVID-19, and rising prices (just like rising wages in the employment report).
ISM employment - sept2021
ISM indexes - sept2021
ISM prices - sept2021
The comments from the participants are always revealing and show how pervasive, and almost frantic, their concerns are over lack of labor, supply chain disruptions, COVID-19, and rising prices (just like rising wages in the employment report).
covid lists - sept2021

Finally, like the employment report and the ISM data, high-frequency data (weekly or even daily) are also indicating a slowdown in the economy. In particular, measures of activity in the customer-facing service industries are declining.

August 31st saw the lowest TSA throughput of the entire recovery. Open Table reservations are declining, as is hotel occupancy. The Delta variant of COVID-19 is likely largely responsible for this decline.

JP Morgan - sept2021
The latest COVID-19 charts are shown below and indicate how rapidly cases and deaths are rising in the US, and how the vaccination effort is still falling short.
daily cases - sept2021
confirmed per million - sept2021
daily deaths - sept2021
vaccinated people - sept2021
vaccinated doses- sept2021
The economy isn’t in peril, but as shown in the reports above, the Delta variant of COVID-19 is surely weighing heavily on it.
We're always producing new content to help businesses understand economic trends and navigate trade uncertainty.
Sign up for our newsletters to make sure you don't miss anything.