
Gross Domestic Product (GDP), the dollar amount of goods and services produced by the economy grew at a 6.5% annualized pace in Q2. The result has been characterized as a disappointment since it was well short of consensus expectations of 8%-8.5%, and that is true. In addition, three of the four major components subtracted from the headline – investment, government spending, and net exports. But some perspective and some details paint a more positive picture.

US Economy: Mixed News, Good Outlook
Dan North | August 2, 2021
There has been a lot of mixed news lately, but the outlook remains good.
First, that 6.5% growth rate was the fastest in 18 years (outside of the pandemic rebound in Q3-20).
Second, it was also faster than the previous quarter.
Third, it also drove the dollar value of production above pre-pandemic levels for the first time, meaning that we have finally caught up to where we were at the end of 2019.
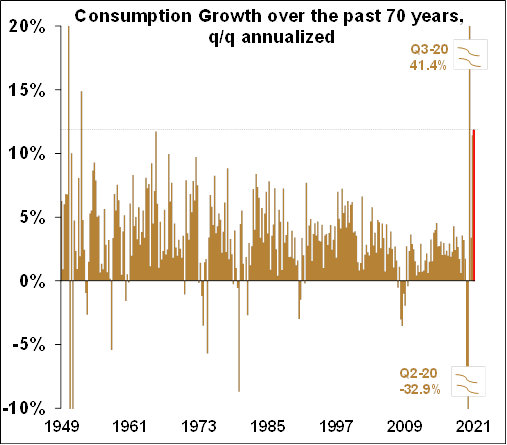
Finally, all of the growth was driven by the super-heated consumption component which grew at a dizzying 11.8% pace. That was the fastest since Q4-52, almost 69 years ago. In fact, it has only been surpassed twice in the post-WWII era. So there are some pretty good results from the report.
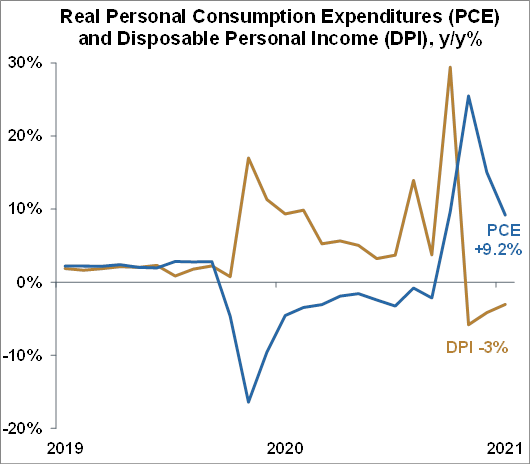
While the GDP report covers the entire quarter of consumption, the Personal Consumption Expenditures (PCE) report breaks it out monthly. Real PCE rose +0.5% for the month, leaving the y/y rate at a historically red hot 9.2%.
Real Disposable Personal Income (DPI) fell -0.5%, the third consecutive drop, putting the y/y rate down to -3%.
That decline is due in part to the fact that the effect of all those juicy stimulus checks from March 2021 are now wearing off.
Like most government data the PCE report lags the actual performance of the economy by a month.
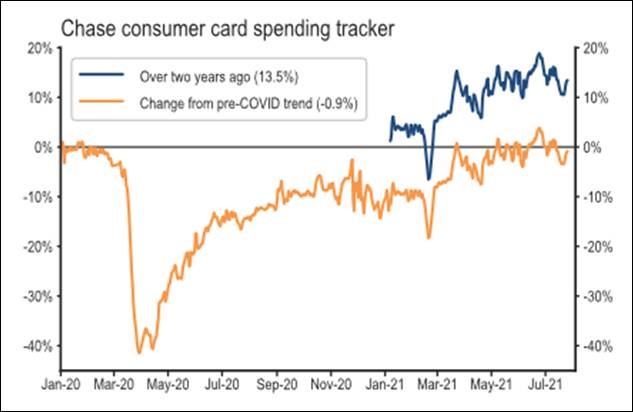
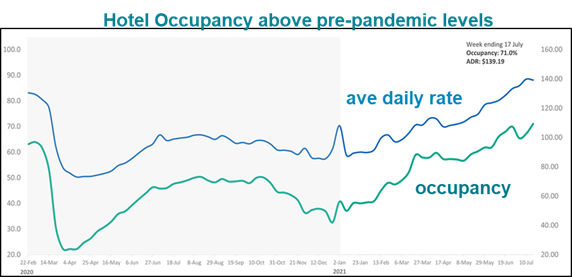
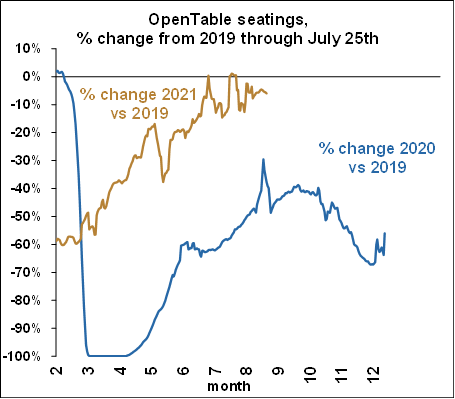
However, some other private indicators which are reported on a weekly or even daily basis show that consumers are indeed out in force:
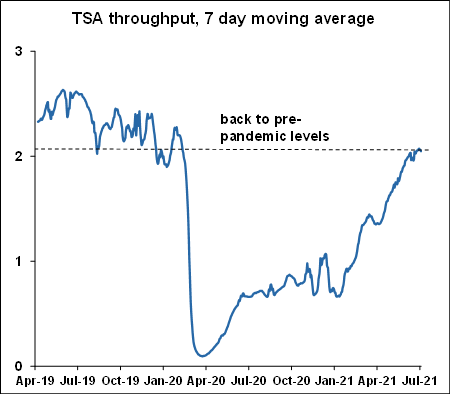
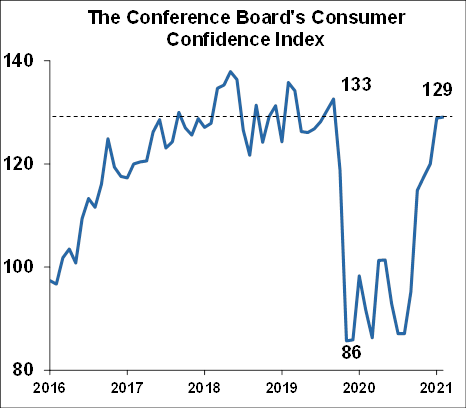
Consumer Confidence Index
So consumers are indeed on a spending spree.
Excess savings have provided consumers with the ability to spend, and consumer confidence has provided them with the willingness to spend.
The Conference Board’s Consumer Confidence Index rose for the sixth straight month, landing at 129.1, a huge 43.4 point recovery from the pandemic low of April 2020.
The Index now stands around pre-pandemic levels.
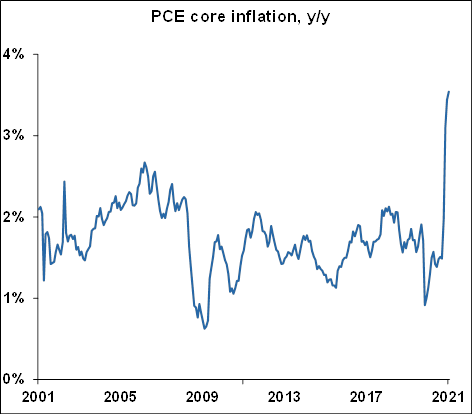
PCE Core Price Index
The aforementioned PCE report also contains the Federal Reserve’s favored inflation gauge, the PCE core price index, which rose +0.4% m/m and has been running quite hot over the past three months, resulting in a 3.5% y/y growth rate, substantially above the Fed’s long-term target of around 2%.
The Fed
And that brings us to the Fed, which held one of its eight meetings of the year in mid-July 2021.
The Fed is charged with keeping the economy from running too cold, which causes high unemployment, or running too hot, which causes inflation. And that hot inflation has become a recent worry for the Fed.
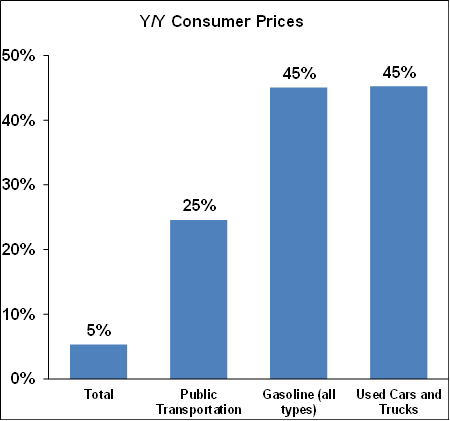
The Fed keeps telling us that this recent inflation is temporary. They do have a reasonable argument that the inflation seems to be contained to things like housing.
Another example is supply chain snafus which have caused shortages of materials like computer chips, which are needed for new cars, whose availability, in turn, has dropped, causing prices of used cars to rise by an astronomical 45% y/y.
However, business people on the front lines are not agreeing with the Fed, at all.
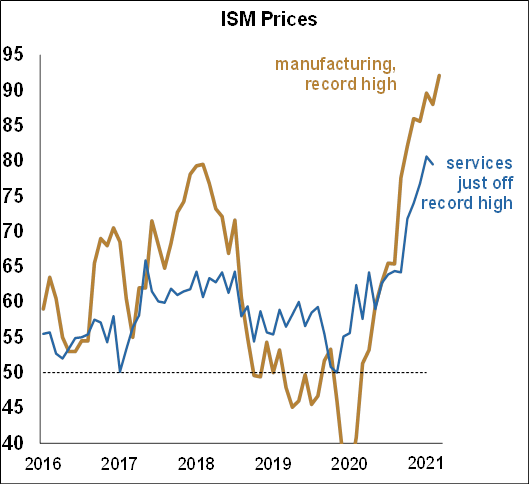
The Institute of Supply Management’s (ISM) monthly Report on Business is a carefully watched survey that has 10 components, one of which is pricing.
Pricing pressures for manufacturing are at a record high and services are just off a record high last month (June 2021).
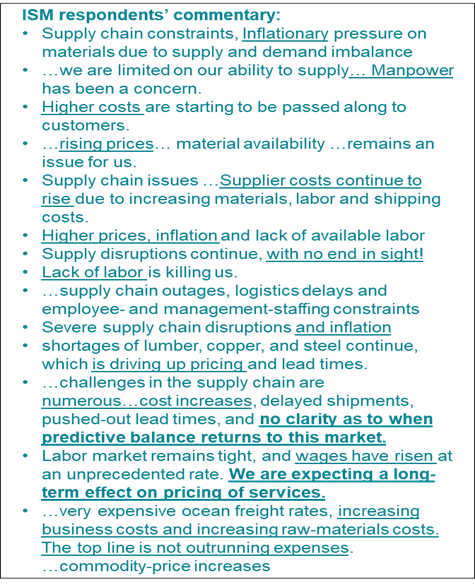
The survey also publishes comments from the participants who are frantically pointing to persistent snarls in the supply chain driving up prices.
The representative sample below shows how different their view of inflation is from the Fed’s. You get the feeling their hair is on fire, and more importantly, they see no end in sight.
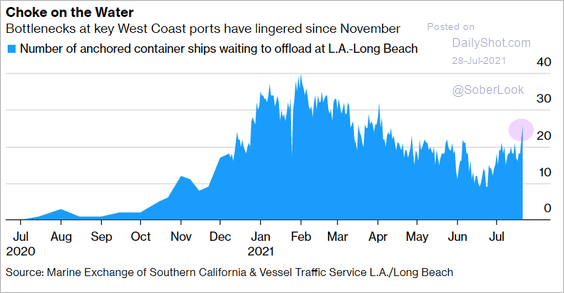
Here is some evidence they may be right that there is “no end in sight”. How is this for a bottleneck – container ships waiting to be offloaded at the country’s two largest ports.
In any event, the Fed is in no hurry to make any changes to policy, and its own forecast suggests no hike in interest rates until 2023. However, a slight change to the wording in the end of July’s statement suggests that it is starting to contemplate tightening with its other tool, Quantitative Easing (QE), or purchases of Treasury and mortgage-backed securities. These purchases keep credit flowing, lubricating financial markets, and providing stimulus to the economy with lower long-term interest rates. Since so much easy money tends to cause inflationary pressures, slowing the pace of those purchases will be the Fed’s first move.
Moving to other reports, recent housing data was been disappointing. New home sales fell for the third straight month, falling -6.6% m/m in June as opposed to expectations of at least some positive growth. Pending home sales also fell -1.9% m/m vs. expectations of growing 0.5%. Existing home sales did grow 1.4% m/m but it was only the first gain in five months.
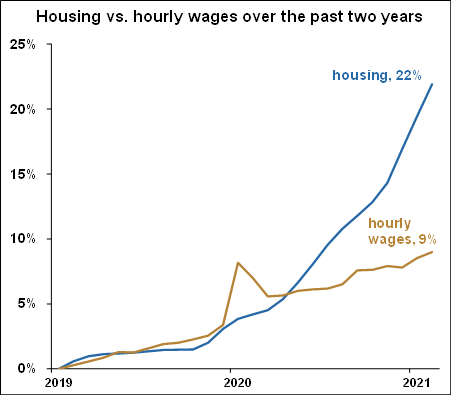
It should be noted that housing data often swing wildly from month to month. But again, why the long string of disappointments? Probably because prices have been rising at an extraordinary rate. The Case-Shiller national home price rose 1.75% m/m in May, the highest in 34 years of data. The resulting y/y rate was an astounding 16.6%, again a record.
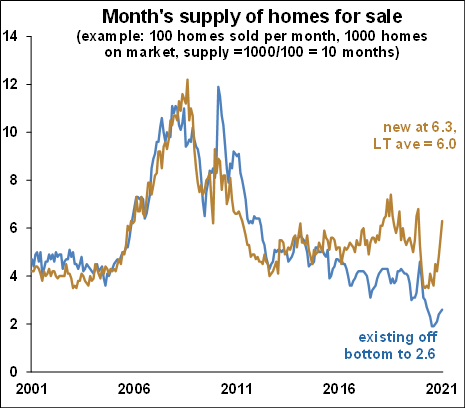
The previous record was in the previous month at 14.8%. How does that compare to wage growth? Well if we start in recent “normal” times such as January 2019, home prices have risen a total of 22% over that period. In the meantime, wages have risen a mere 9%. Surely this is an unsustainable trend. Perhaps if demand keeps falling, and supply keeps rising as shown below, price appreciation will moderate.
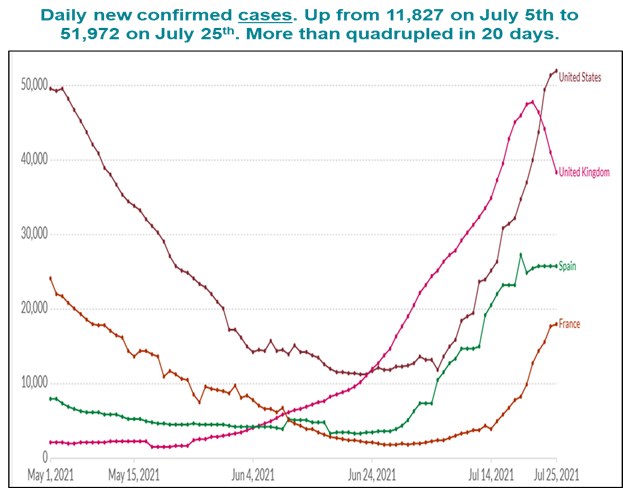
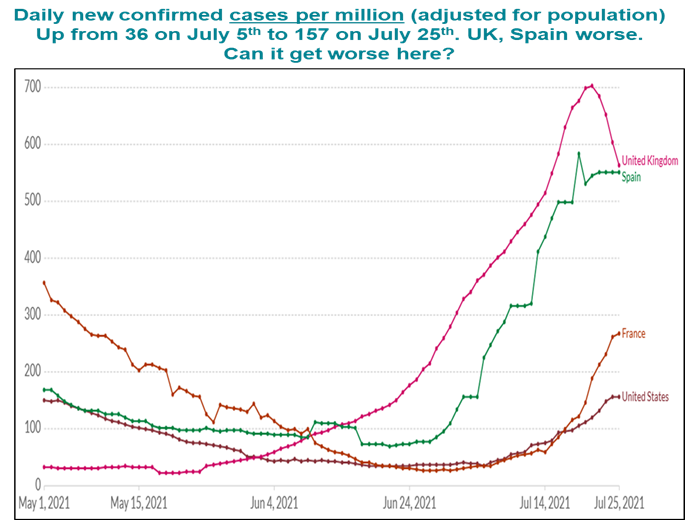
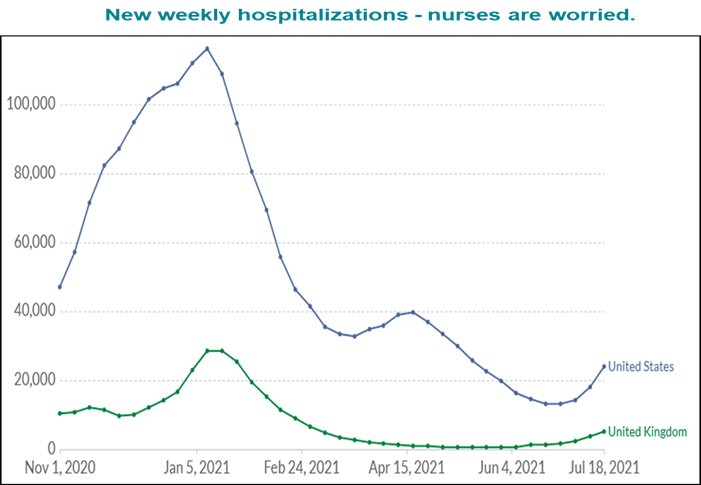
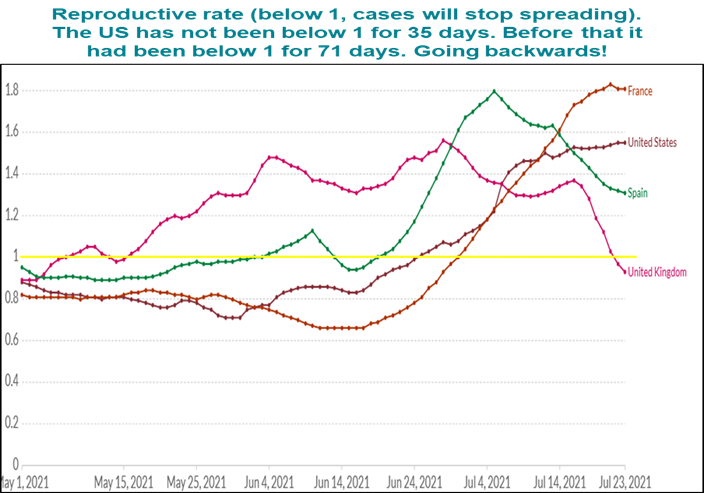
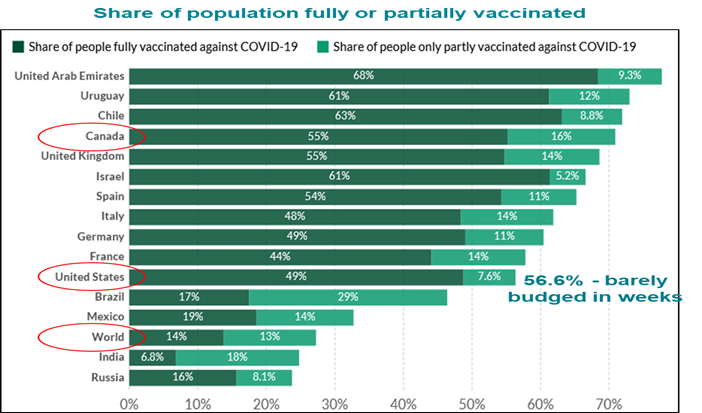
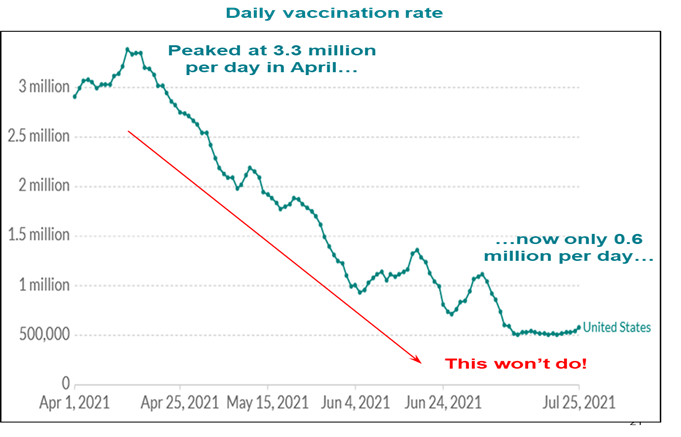
COVID-19 Data
There is no good news on the COVID front, unfortunately. The big question is will governments issue shutdown orders as severe 2020? We don’t think so, and the consumer has enough savings to keep going, but…. I really can’t tell you how the Delta variant (or some other variant) could accelerate....
Wrapping up
So what’s the bottom line of this mish-mash?
Inflation is largely caused by supply constraints, and the combination of the Delta variant and slowing vaccinations could knock the forecast down some. But consumers are out in force with excess savings and confidence, driving the economy along. However, they are just not buying houses because prices are too high.
Overall the economy is still in very good shape and we expect strong growth the rest of this year into next year.
More articles to explore


Get economic & trade content in your inbox
We're always producing new content to help businesses understand economic trends and navigate trade uncertainty.
Sign up for our newsletters to make sure you don't miss anything.
Sign up for our newsletters to make sure you don't miss anything.