
Job growth in May was a bit disappointing as the economy created 559,000 jobs vs. expectations of 670,000. In addition, the previous two months were revised up a total of only 27,000 jobs.

Employment tepid, rest of economy epic
Dan North | June 4, 2021
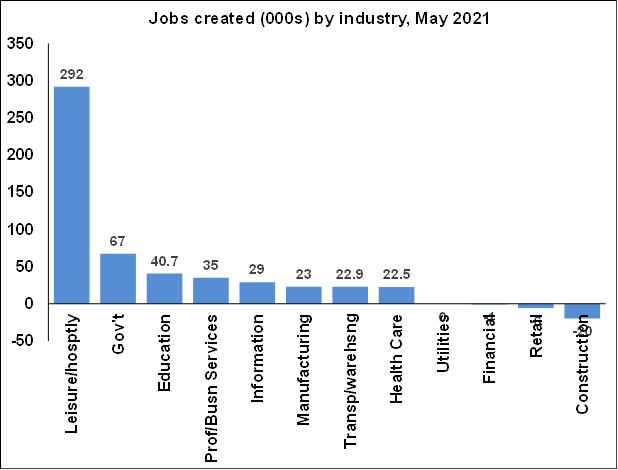
Jobs created by industry
Despite job gains, there were some surprising losses. Construction lost -20,000 jobs, the third decline in four months. Retail lost -6,000 jobs but had lost -10,000 in April as well. However, manufacturing gained 23,000, offsetting some of the last month’s -32,000 loss.
Leisure and hospitality once again carried the day, providing over half the gains with 292,000 jobs created. Last month leisure and hospitality made up all of the gains and more, creating 328,000 jobs while the overall economy created only 278,000 jobs. Clearly, this sector is the engine of job growth, and will be as more states continue to ease restrictions, and bars, restaurants, and hotels are ramping up business and employment.
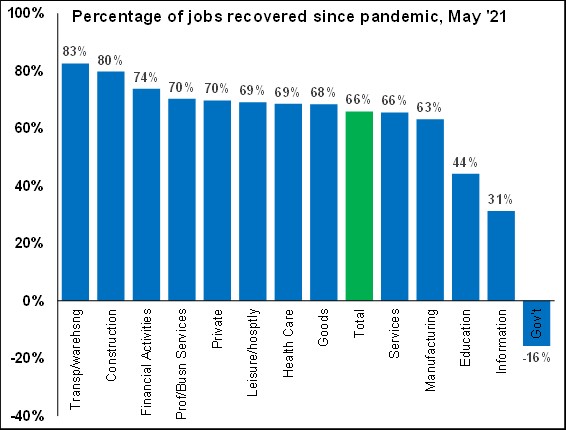
Jobs recovered by industry
Some industries have recovered more than others from last year. Transportation and warehousing have done best – think Amazon. Construction has done well with terrific demand for new homes.
Education is way off the pace – fewer teachers returning to the workforce. Government is still below pre-pandemic levels (as is utilities, but the numbers are distorted).
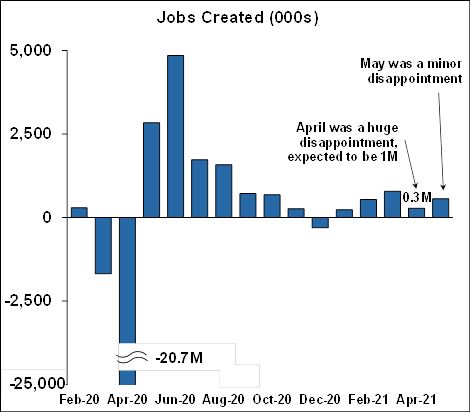
Pace of job growth
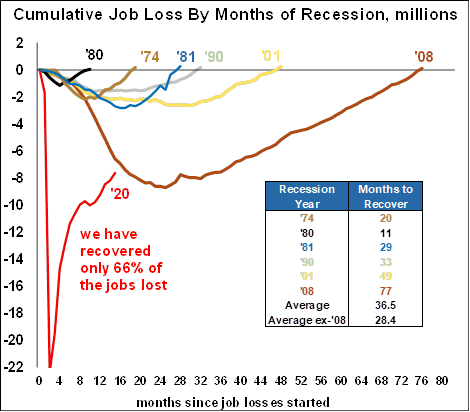
Overall the pace of job growth has been frustratingly slow as shown in the first chart below – two steps forward one step back. The second chart below shows how long it has taken to get all of the lost jobs back in previous recessions, which is around three years. Therefore it’s likely that it won’t be before later in 2022 until we have recovered all of those jobs. With this report, the economy has regained 66% of the jobs lost last March and April, vs. 63% last month – progress, but slow progress.
Jobs created
Cumulative Job Loss
Employment indicators
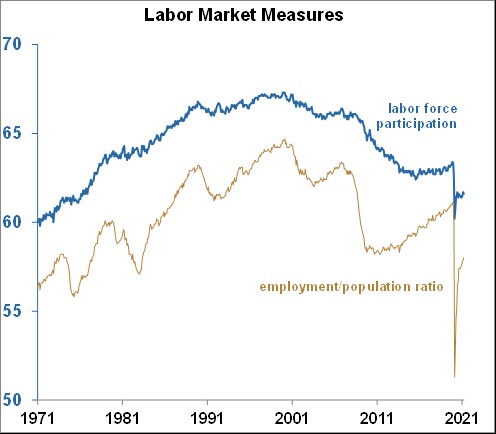
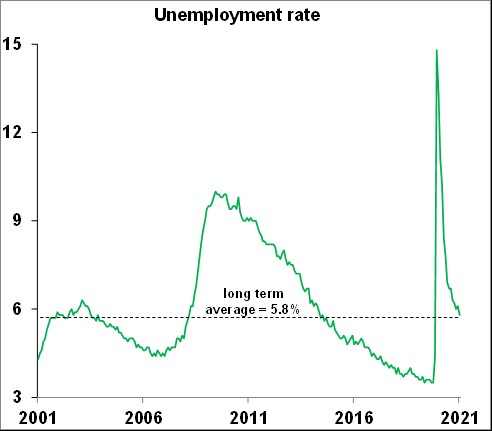
The unemployment rate dropped from 6.1% to 5.8%, which is great, but the unemployment rate by itself isn’t really that helpful a number, and here’s why. The unemployment rate is defined as the number of unemployed people divided by the number of people in the workforce (people who are working + people who are unemployed and looking for work). But if you are unemployed and not looking for work you are not counted as unemployed, you are counted as “not in the labor force”, or not participating in the labor force.
Here’s a simple example that shows how the unemployment rate is misleading by itself. Suppose 99 people are working and 1 person is unemployed but looking for work. The unemployment rate is 1% = [1/(1+99)]. Sounds great, but the number of people who could be working is 261,000,000. Ninety-nine people working is hardly enough to feed 261,000,000 mouths.
There are two other measures that, in my opinion, are more indicative of the health of the labor market. These are the labor force participation rate and the employment to population ratio. The labor force participation rate is the percentage of the population that is either working or unemployed and looking for work. The employment to population ratio, also known as the employment rate, is simply the percentage of the population actually at work – it’s a very simple concept showing how much of the population is actually powering the economy ahead.
Unfortunately, both measures remain well below the pre-pandemic level. In fact, the labor force participation rate is the lowest it has been in 44 years, and the employment/population ratio is the lowest it has been in 38 years. These measures confirm the chart above showing that we have a long way to go before the labor market is completely healed. By contrast, the unemployment rate has recovered much more quickly, is right at the post-WWII average of 5.8%, and is lower than it was just 7 years ago – a little misleading when compared to other measures.
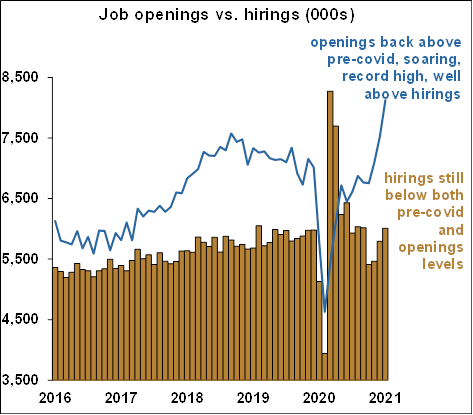
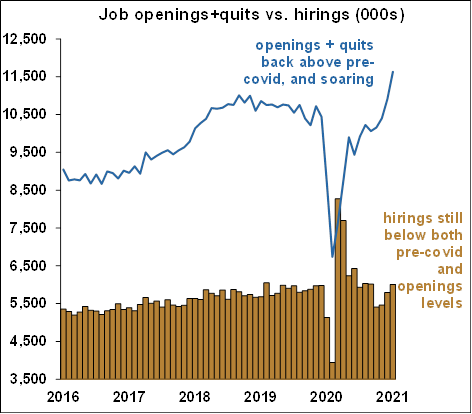
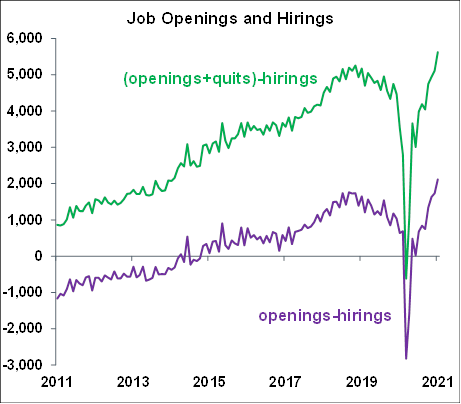
So job growth has been lukewarm at best over the past two months, but it’s certainly not for lack of demand. Employers are begging for jobs. The first chart below shows that the number of job openings is back above pre-Covid levels, at a record high, soaring, and is well above the number of hirings. The second chart adds the number of voluntary quits to the number of openings and tells an even more powerful story. A high level of quits means employees must be very confident about finding another job because there are so many jobs to be had.
Here’s a different way to tell the same story. Let’s measure the gap between the blue lines and the tan columns in the charts above. The results are shown in the chart below. The purple line shows the gap between openings and hirings. The green line shows the gap between (openings + quits) and hirings. Of course, they are both at record highs.
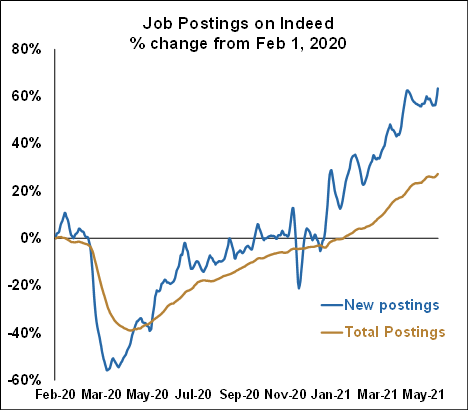
Demand for jobs is also extraordinary in the daily data from the Indeed job posting site.
It’s clear that the record demand for labor is due to the re-opening of the economy and the resulting spectacular activity. But why the lack of hiring? Several reasons:
- Permanent job destruction likely resulted in many employees simply retiring early
- Fear of Covid in the workplace
- Lack of childcare
- $300/wk. extra unemployment benefit providing a disincentive to work
The last one is a policy that can be changed, and indeed 25 states are now rescinding that extra benefit starting in June or July. It had been scheduled to phase out in September. One study concluded that the extra benefit roughly doubled the normal benefit and provided a yearly income around twice that of the federal minimum wage, clearly providing a disincentive to return to work. The elimination of this benefit should give a boost to the employment report over the next few months.
Consumers are still ravenous
Here are up-to-date weekly and daily measures of consumer activity, all of which are on sharp upturns.
Consumer card spending: JP Morgan credit card tracker up 11.7% compared to 2019 (that is compared to more normal times).
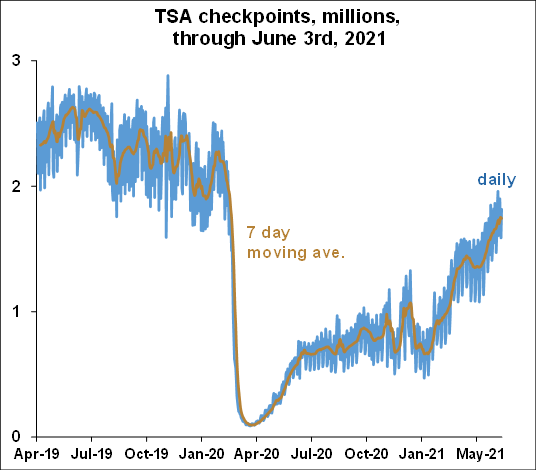
Air travel trends: People are flying. By the way, flying isn’t as bad as it was before Covid – it’s much worse. The airports are just as crowded, but the TSA lines are longer because there are… not enough workers. And carry something to eat with you. Airport restaurants have not been opening before lunch, and the lines give you a sense of utter hopelessness because – can you guess? – there are not enough workers.
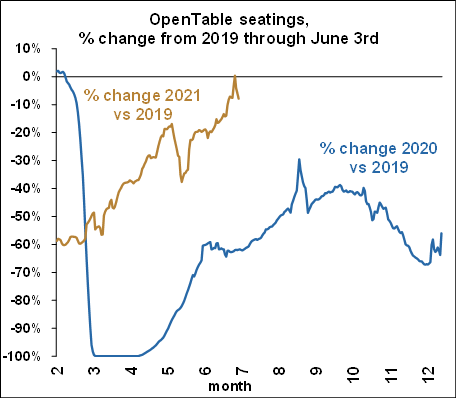
Dining reservations: OpenTable dining reservations this year, as shown by the brown line, have been on a tear. They recently rose above pre-pandemic levels then gave a little ground back, but they will surely start going back up.
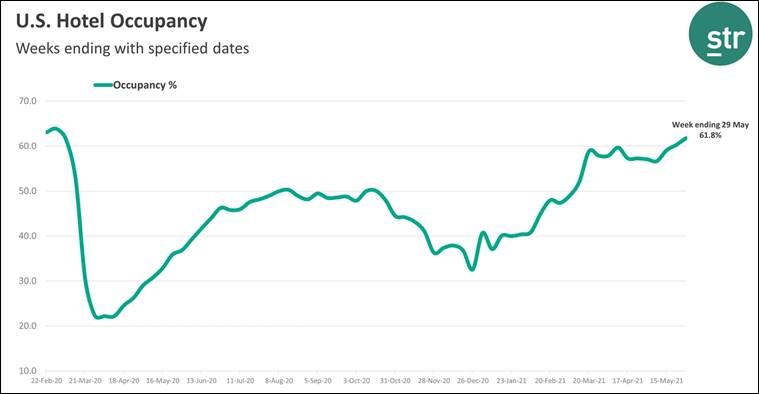
Hotel occupancy: Hotel occupancy back near pre-pandemic levels (the chart starts at 2/22/20).
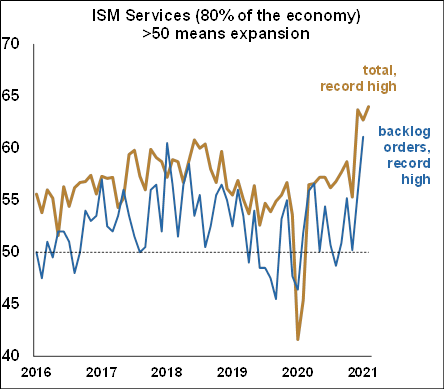
The Services sector continues to skyrocket
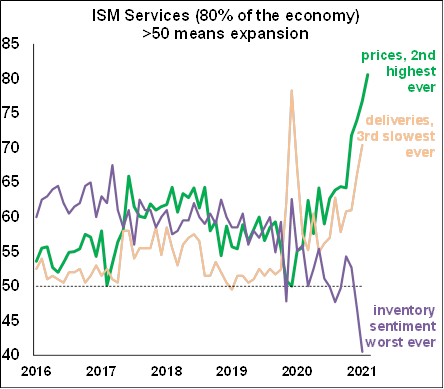
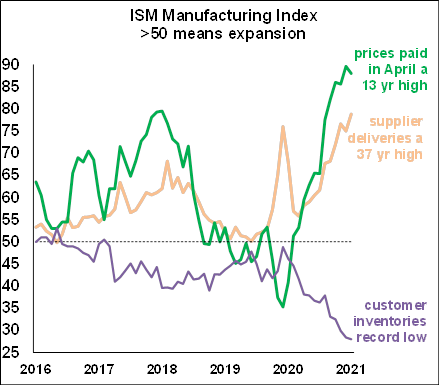
The ISM services index which covers 70% - 85% of economic activity, was extraordinarily strong in May. The total index hit a record high. The backlog of orders, which means months of work in the pipeline hit, yes, a record high. Supply chain bottlenecks have caused delivery times to drop to the third slowest on record (normally slower delivery times indicate a hot economy, but in this case, they also indicate supply chain disruptions).
As a result, prices for goods and services are getting bid up to the second-highest level ever, and inventory sentiment is at a record low. The ISM survey simply asks participants if conditions in ten categories are better, the same, or worse than last month. So conditions can drop in any given month but still remain above the 50 level indicating expansion.
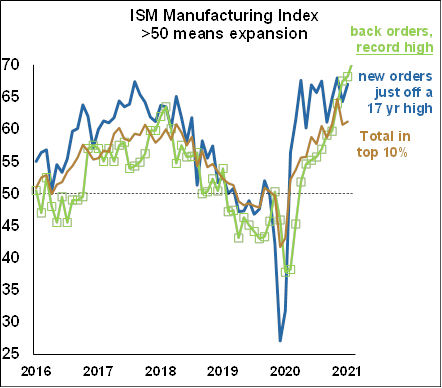
But it’s unusual to see the curves so steep and so high, indicating that virtually every month, the economy is hotter than the previous hot month. In other words, if you say things are better than last month, which were better than the month before that, which were better than the month before that, etc., it surely indicates a super-heating economy. And that super-heating economy is also creating the inflationary pressures shown in the reports. I’ve put the ISM manufacturing charts in from June 2 so you can see the same steep curves, record highs, and price pressures.
As always the participants’ comments are revealing, and like the manufacturing survey, show that demand is tremendous. However you get the impression that many businesses were caught off guard and are frantically trying to catch up. However, huge unexpected obstacles such as a lack of labor, supply chain disruptions, inability to get goods, and rising prices are making operations very difficult.
- “Stimulus money, increased vaccinations, increased dining capacity and pent-up demand are driving a fast recovery for dine-in restaurants — and all consumer segments, it seems — resulting in labor shortages and supply chain gaps.” [Accommodation & Food Services]
- “Container delays are impacting our supply chain in a significant way. Delays at the Port of Montreal and West Coast ports have impacted our ability to provide products in growing season. Truck availability has generally been tighter than normal. We’ve seen a real impact in the southeastern market.” [Agriculture, Forestry, Fishing & Hunting]
- “Business continues to improve, and we have worked through many of the supply chain disruptions at this time. We have begun to return to work at our corporate office on a limited basis.” [Arts, Entertainment & Recreation]
- “We are still busy and adding employees. One of the biggest concerns now is shortages of crucial material and equipment. Metal coils for production are especially scarce. Equipment and material suppliers have been raising prices since the first of the year. We hear of a new increase almost daily.” [Construction]
- “We anticipated the reopening reasonably well but were caught off guard with respect to some materials. Steel and copper went higher than anticipated, and shortages are having an impact.” [Finance & Insurance]
- “As the vaccination rate continues to climb and the coronavirus (COVID-19) infection rate continues to plummet, business conditions are steadily improving: Strong revenue performance is returning, and outlooks are improving. Some supply categories remain constrained (nitrile gloves, sterile wrap and the like), yet are somewhat manageable, limiting the impact to daily operations.” [Health Care & Social Assistance]
- “(We are) seeing cost increases and long lead times with steel and steel containers. Worker shortages, temp labor and the like.” [Management of Companies & Support Services]
- “Transportation, labor, steel and general commodities are all increasing (in price) based upon general inflation and the rising price of oil.” [Mining]
- “Small businesses in the area are reporting stimulus checks and extension of unemployment are hampering their ability to hire workers. Seasonal labor and H-2B (visa) workers are in very short supply, causing an uptick in cost per hour. Some employers are reporting they are offering cash incentives of (US)$50 if you show up for an interview.” [Professional, Scientific & Technical Services]
- “Business is very strong, and customer orders continue to increase at a rapid pace. Material shortages, increased prices and qualified personnel shortages are becoming a much larger concern.” [Real Estate, Rental & Leasing]
- “Very concerned about the rapid and continuing price escalations for any products with copper, steel, and polyvinyl chloride (PVC). Production issues and lead-time extensions are not improving.” [Retail Trade]
- “Business is doing good, exceeding sales target, but we have challenging issues with (1) increases in raw-materials costs and freight rates, (2) huge freight delays from overseas and (3) continued U.S. port delays. The (COVID-19 surges) in India and Taiwan are also causing delays on product availability/shipments.” [Wholesale Trade]
The Covid situation continues to improve
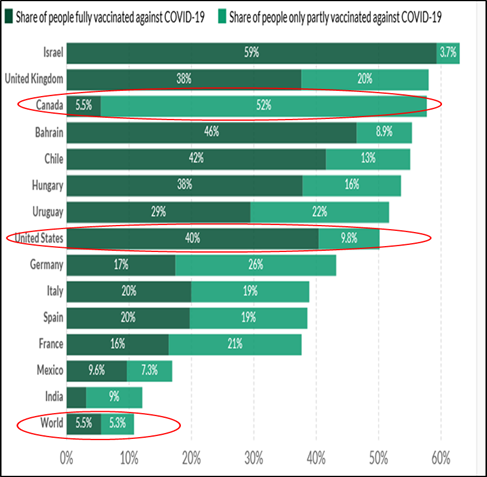
The administration of vaccines is slowing, perhaps because we have already picked the “low-hanging” fruit of those who wanted to get it, but progress to date is very encouraging.
Share of people either fully or partially vaccinated. US is in very good shape, Canada getting there.
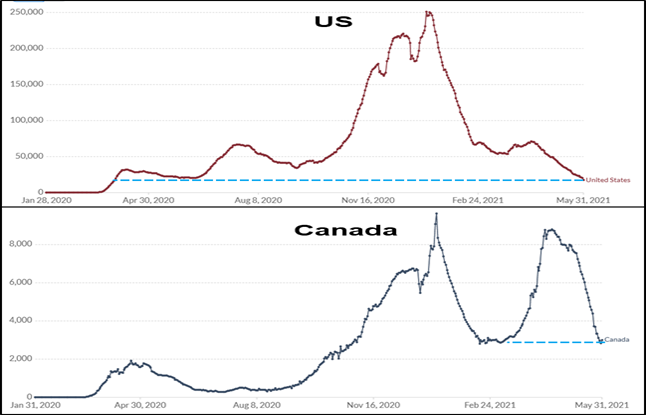
Daily new confirmed cases. US down 93% from January peak. Down 76% from mid-April peak. Lowest since March ‘20. Canada down 69% and 66%, but a ways to go.
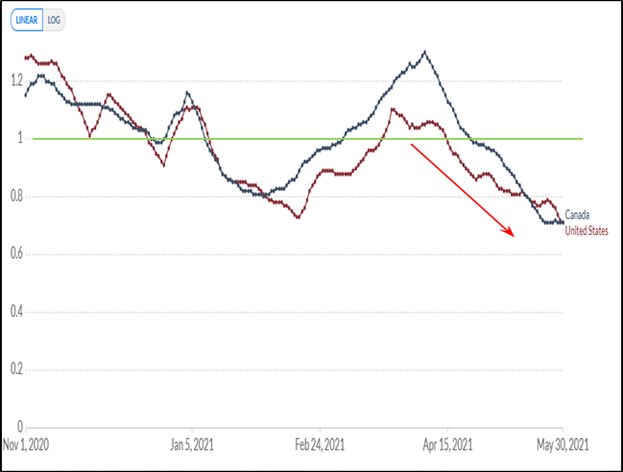
Reproductive rate <1 means in theory disease will stop spreading. US has been below 1 for 49 days, Canada 40 days, and the downward trend is clear.
Wrapping up
Although job growth has been a little soft, it’s likely to get better in the coming months. In the meantime data from consumers, service providers, manufacturers, as well as Covid metrics are all very, very good, and it looks like they will be for quite some time.
More articles to explore


Get economic & trade content in your inbox
We're always producing new content to help businesses understand economic trends and navigate trade uncertainty.
Sign up for our newsletters to make sure you don't miss anything.
Sign up for our newsletters to make sure you don't miss anything.