US Personal Income and Consumption: How Many More Records Would You Like?

Dan North | April 30, 2021

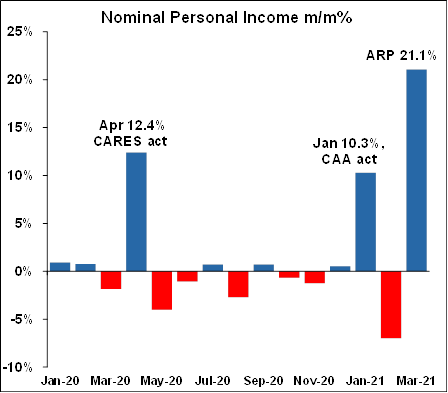
As expected, the April 30th Personal Income (PI) and Personal Consumption Expenditures (PCE) report for March was nuclear-powered and contained several records for the 62 years of data since 1959.

  • Personal Income growth on a m/m basis set a record high, by a long way, at 21.1%; before the pandemic stimuli, the previous record was only 4.6%, one fifth the growth in March. And note that is only March compared to April, not annualized.
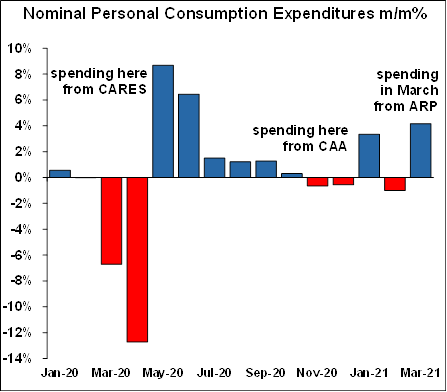
  • Spending growth was spectacular at 4.2%, and again outside of the pandemic recovery months, was a record high.
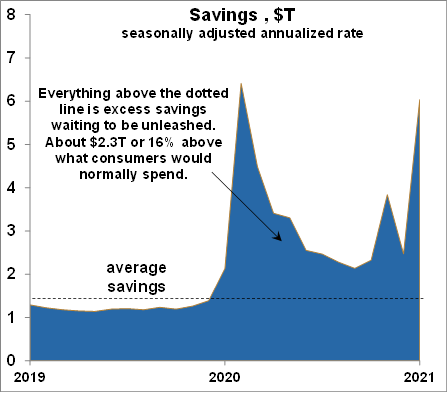
  • But once again consumers just couldn’t spend all of that extra income, so excess savings set another record high at about $2.3T (on an annualized rate), or a gigantic 16% above what consumers would ordinarily spend. It also represents about 11% of GDP.
  • Disposable (after tax) personal income (DPI) also set a record high growth rate of 23.6% m/m, far eclipsing the pre-pandemic record of only 6.2%
  • Real DPI, adjusted for inflation also set a record at 23.0%, again easily out-running the pre-pandemic record of only 5.8%.
  • Real PCE, outside of the pandemic, of course set a record high of 3.6%.
Nominal Personal Income - April 2021 Chart
Nominal Personal Consumption Expenditures - April 2021 Chart
April 2021 Savings Chart
Conference Board Consumer Confidence - April 2021 Chart


Consumer confidence

Clearly the stimuli and the excess savings are providing consumers with the ability to spend. And now consumers have the willingness to spend as well. 

The Conference Board’s Consumer Confidence survey has soared recently. 

Over the past two months, the overall index has risen 31.3 points, a record, while the “Present Situation” component has risen 50 points, also a record.

Government data is usually reported monthly and with a lag of about a month. Here are some newer indicators we’ve been watching which cover up to the end of April 2021.
J.P. Morgan/Chase credit card spending tracker on the rise:
Chase credit card spending - April 2021 Chart
People are moving around – economic activity:
US visitors - April 2021 Chart
People are flying:
TSA checkpoints - April 2021 Chart
Hungry? People are eating:
OpenTable seatings - April 2021 Chart
Go away for a few days to a hotel, anyone? Apparently so. Low point was 22%, now 57%, right around pre-pandemic rates:
U.S. Hotel Occupancy - April 2021 Chart
The ISM indexes both for manufacturing and services are, you guessed it, setting record highs. Note that back orders and new orders are leading indicators in that there is plenty of work already in the pipeline to provide future income to workers.
ISM Manufacturing Index - April 2021 Chart
ISM Services - April 2021 Chart
Financial markets are also providing leading indicators. The yield curve (the blue line) is strongly positive suggesting a continued recovery for at least the next 3-5 quarters.
Treasury Yield Curve vs. GDP - April 2021 Chart

The stock market is also forward looking.  At the beginning of every quarter, stock analysts forecast how much companies will earn in that quarter. Typically those analysts are overly optimistic and have to revise those estimates down during the quarter. 

But not for the past three quarters – even the overly optimistic stock analysts are getting surprised and having to revise their forecasts up. And of course, the most recent quarter was the biggest on record.

S&P 500 Earnings - April 2021 Chart

The combination of warmer weather, increased consumer confidence, lifting of Covid restrictions, and an improving Covid situation (the Director of the NIH said on April 25th that some regions of the country are “getting close” to herd immunity) are setting the stage for a great year. 

However it’s clearly the stimulus checks and the extra unemployment benefits which are really setting the economy on fire. But remember there is a price for all of this stimulus, and maybe we should at least think about it.

Consider that:

  • The disheartening new term “stimmy checks” suggests that they are being used more for frivolous pursuits rather than out of necessity.
  • Consumers can’t even spend all the money they’ve been given, try as hard as they can
  • Some have bet it in the stock market
  • Employers are begging people to come back for work but stimulus benefits are keeping them on the sidelines
  • Inflationary pressures are building, and
  • To finance the stimulus plans the debt load will soar to the point that it will slow the economy to less than half the long-term growth rate over the next decade.

Recently the Congressional Budget Office (CBO) issued a projection of the debt/GDP ratio going out to 2051, and really, it’s almost comical at 202%.  By comparison, in the period from 1962 to the financial crisis, the debt/GDP ratio averaged only 32%. That projection doesn’t even include the $1.9T American Rescue Plan, the $2T American Jobs Plan (infrastructure), or the $1.8T American Families Plan. Who wouldn’t want all the goodies in these plans? We’d all like to have everything, but normally we are constrained by what we can pay for. But apparently politicians aren’t. It’s just that you, the taxpayer, will have to pay for all of this.


CBO’s debt/GDP ratio forecast

I don’t want to end on a down note. 

The debt load problem is in the future, it just merits consideration.

For now enjoy the truly great, record-setting data which is going to make this a fabulous year.
We're always producing new content to help businesses understand economic trends and navigate trade uncertainty.
Sign up for our newsletters to make sure you don't miss anything.