Economic Update: Consumers Roaring into Spring 2021

Dan North | March 29, 2021

The U.S. consumer is starting to awake after a long winter’s sleep.

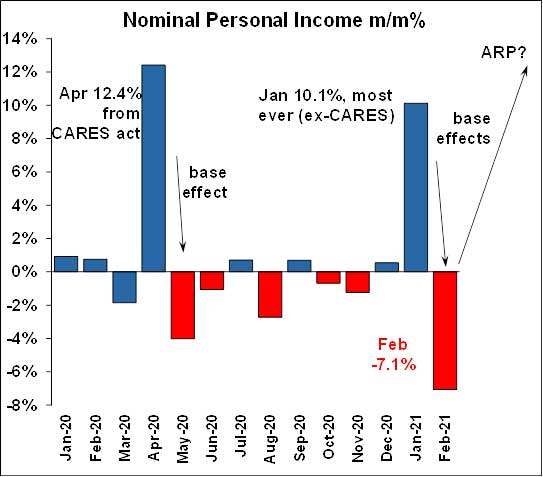
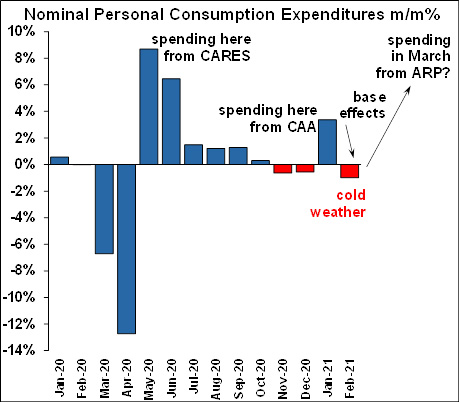
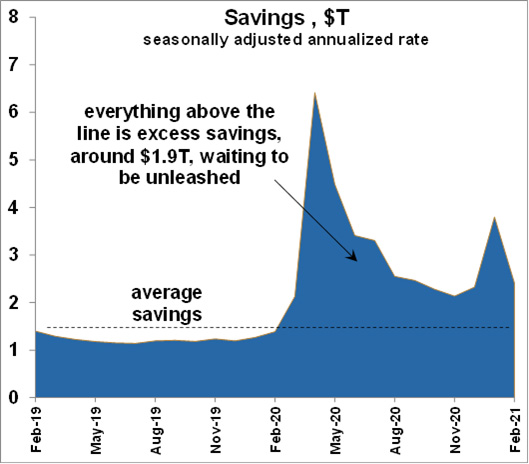
Let’s start with those charts on personal income (PI), personal consumption expenditures (PCE), and excess savings again. February’s PI/PCE report looked bad but it was a fake-out. Personal income fell -7.1% m/m, but that was expected because the prior month, January, had such a huge boost from the Consolidated Appropriates Act (CAA) which was the $900B stimulus act passed in December 2020. It’s an example of what’s called the base effect, which means that a month/month change can be distorted based on what happened in the prior month. 

For example, let’s say income in the first month was $100, and income in the second month was $99, then the m/m change would be -1%. But suppose income in the first month had been $1,000 and income in the second month was $99 like before. That would result in a m/m change of -99%. The income level in the second month was the same in both cases, but it was the income in the first month which created the distortion, and that’s what happened with PI in the February report. Stimulus checks from the CAA boosted PI by a gigantic $2.4T (annualized rate) in January. But by February, most of the CAA checks had gone out, resulting in a dramatic loss in PI, largely due to the distortion from the base effect.

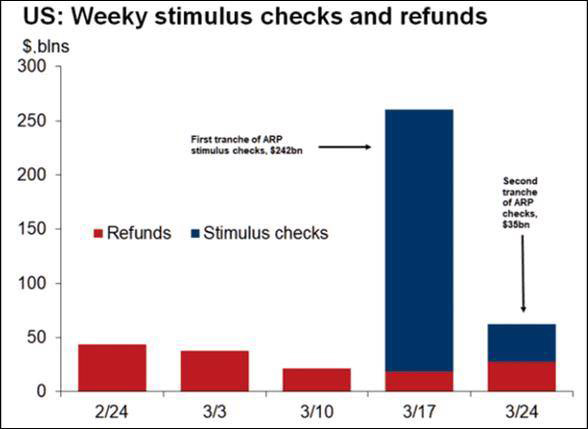
But, it goes both ways. So next month (April 2021) we are going to see a gigantic increase in PI from the $1,400 checks of the American Rescue Plan (ARP). The point is, PI is to come roaring back in the government’s March report. In fact, a private (non-government) more up-to-date report from Oxford Economics / Haver Analytics, shows that it actually has. 


Stimulus checks

Two-thirds of the ARP’s stimulus checks were disbursed in a week, and income tax refund issuance is up sharply from last month (according to Oxford Economics / Haver Analytics data).


Personal Consumption Expenditures

Personal Consumption Expenditures (PCE), representing almost 70% of all economic activity, took a double hit in February, first from a base effect, and secondly from brutally cold weather which crippled part of the nation for an extended period. PCE is going to come roaring back in the March report as well.


Savings

And of course, the February report juiced up excess savings to almost $1.9T. By the way, how much is $1.9T? It’s impossible to know without comparing it to something else. $1.9T represents a huge 7% boost to annual GDP, and a gigantic 11% increase over what consumers might normally spend in a year.

Indeed, by some other measures, it looks like consumers, and the economy, are already roaring into spring. Here are some other charts I like from the Wall Street Journal over the past few days. 

These charts are nice because unlike the government’s monthly PI/PCE report, they are very timely and up-to-date, often showing data from the most recent week (or even daily), they are narrowly focused on specific market segments, and the surveys are produced by private (not government) participants directly involved in their markets.

Chase consumer card spending tracker
Americans on the Move for Spring Break Chart
Propensity to Spend chart
Total Card Spending chart
Air Travel Chart - Scotiabank
Restaurant Diners and Payroll chart - March 2021
Job Posting on Indeed
Job Tracker chart - March 2021


Speaking of a hot labor market, regular initial jobless claims fell a sharp -12% during the week of March 22 to the lowest level of the pandemic. In addition, Pandemic Unemployment Assistance (PUA) initial jobless claims fell a sharp -15%, also to the lowest of the pandemic.

Canadian Business Confidence: Canadian Federation of Independent Business (CFIB), Business Barometer


Consumer confidence

For me, this is the biggest one of all because it shows once again that the consumer is ready to break out. It’s the first time the survey has turned positive since the pandemic:

WSJ: "Consumers are more comfortable with various social activities, according to an Evercore ISI survey.”

The U.S. consumer is starting to roar awake after a long winter’s sleep. It’s a lovely time indeed!

We're always producing new content to help businesses understand economic trends and navigate trade uncertainty.
Sign up for our newsletters to make sure you don't miss anything.