US: Another Day, Another Round of Stimulus

Dan North | January 23, 2021

As we know, the Federal Government has used fiscal stimulus to help support the economy which has been devastated by COVID-19. The first major act of fiscal stimulus was the Coronavirus Aid, Relief and Economic Security (CARES) Act which created $2.4 trillion in spending. In December 2020, the government passed the Coronavirus Response and Relief Supplemental Appropriations (CRRSAA) Act (which was by far the biggest act ever at 5,593 pages long, enough to make you wonder what’s really in there) for another $900 billion. Now another round of stimulus, the American Rescue Plan (ARP), is on the table for $1.9 trillion, and if you add those three up you get to $5.2 trillion dollars.

When we get into numbers that large, it’s very hard to understand how much that really is. One way to get a better handle on it is to compare it to the “size” of the economy which is known as Gross Domestic Product (GDP). GDP is the dollar value of everything that’s produced by the economy. Since GDP is currently $21.2 trillion, the three stimulus programs add up to almost 25% of GDP as shown below. Another advantage of comparing the amount of stimulus to GDP is that it allows you to see what other countries are doing based on the size of their economies, and as the chart shows we will clearly be in the lead if ARP gets passed.

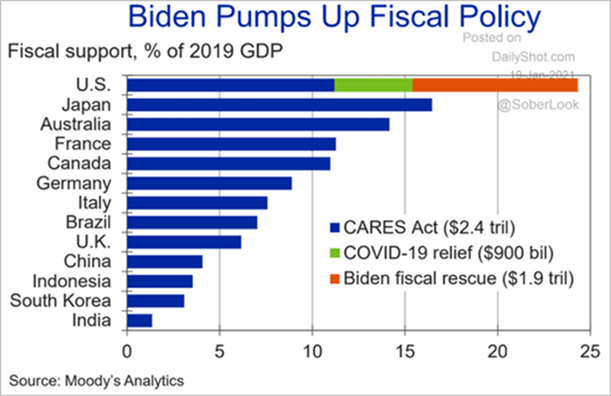
But apparently, President Biden can’t wait for ARP.  On Friday he signed another round of stimulus relief, which among other things will provide money for more food security and speed the delivery of stimulus checks from previous programs.

We have maintained that stimulus spending, in particular, income support, has been the right thing to do all along and it still is. After all, thanks to COVID, 10 months later there are still 10 million jobs missing from the economy, and there are still 14.5 million people claiming unemployment benefits, which is five and a half times the long-term average. People need help.

But the term “stimulus” is wearing thin. A more complete descriptor for this policy might be “stimulus-now, depressant-later”.

First, let’s look at how stimulus-now is supposed to work. It’s typically meant to apply to a recession when consumers are not spending as much money as they did before and the economy is getting weaker as a result. Then the government steps in and spends instead of consumers. That spending stimulates the economy by creating more demand for goods and services and more demand for jobs along the way. It’s important to note that government spending is no better than consumer spending, and often worse, it’s just that the government is doing it because the consumer is not. In theory, it’s a temporary boost until the economy heals – it’s stimulus-now, and it’s expected to boost 2021 GDP to a very strong 4.1% annual growth rate.

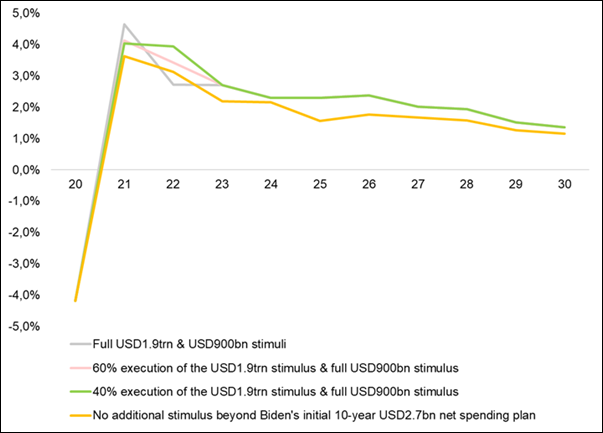
However, there is a downside to this policy as well. We can’t just spend ourselves into prosperity. First, consider that the money for the stimulus has to come from somewhere. The government does not just have a magical, infinite pile of money sitting in a corner. The money either has to come from you the taxpayer now, or the government can borrow it and you the taxpayer will pay it back later. Currently, the government is doing a lot of borrowing to pay for these massive stimulus programs, incurring a tremendous debt load. In fact, our colleagues at Allianz Research have made an estimate of just how much the debt/GDP ratio will rise with all of the stimulus plans. The chart shows four scenarios ranging from getting the full $1.9T ARP program to getting none of it. Right now, the debt/GDP ratio is 126%. By the time we reach 2030, the debt/GDP ratio under these four scenarios will range from about 155% to 165%. For reference, the highest previous record was 118% just after WW-II. (Our massive entitlement programs of Medicare, Social Security, and Income Security (welfare), which account for two-thirds of our budget outlays and are politically untouchable, also greatly contribute to the problem, but that’s another story).

US Debt to GDP Ratio
And the big problem with so much debt is, simply put, it slows the economy in the future. That’s the “depressant-later” part of the stimulus. In fact, the Allianz Research team has also made an estimate of that effect which shows that under any of the four scenarios, GDP growth will decline to only about 1.4% per year by 2030. By comparison, the average growth rate from 1950 until the Great Recession was 3.5%. From the end of the Great Recession to just before COVID it was 2.3%. A decrease to 1.4% is a 39% decline from 2.3% – that’s huge. That’s depressant-later.
GDP growth under four scenarios of Biden’s fiscal stimulus
By the way, the stimulus-now may not produce as big a benefit as hoped. People saved a great deal of the CARES money instead of spending it. The survey below shows that with another round, 35% of the respondents said they will pay bills, but that is money that has already been spent so that won’t help much. And then 15% say they’ll save it like last time instead of spending it. And then 12% say they’ll pay debts, which also isn’t spending (but helps creditors). It looks like only around 15% of the respondents are actually talking about outright spending. The bottom line here is that stimulus will help support people and the economy now, but it will depress the economy later.

Let’s switch to some shorter-term topics.

Retail Sales

Retail sales have been awful, falling in October, November, and December 2020, according to the government’s report, which is the most comprehensive. There are also holiday sales reports from different private sources but they are messy because they examine different time periods (Black Friday, Black Friday weekend, Cyber Monday, November and December, etc.) broken out different ways (mobile, credit card, online, online then pick up, etc.) The bottom line without going through them all is that like the government report, overall sales, especially in brick and mortar during the holidays were simply terrible. It’s no surprise since many retailers had to operate at reduced capacity, and the fear of COVID kept shoppers inside. The only bright spot has been e-tailing which has soared, rising 36% y/y in the first two weeks of December, and 30% y/y through November 2020.

No wonder small business is struggling, with the number of business and employees both down about 30% since January 2020:

Student Debt

I used to be asked all the time about what was going to happen to the student debt problem. My response was always “It will be a taxpayer bailout”. Well, here it is. The deferred repayments under the current stimulus plans mean other consumers (taxpayers) will have to cover the losses that the lenders incurred by paying higher interest rates. Furthermore, taxpayers seem to want to bail out students as shown in the chart below. There is a fundamental unfairness here since many families didn’t borrow money for tuition, and unlike borrowers, they wouldn’t be getting any of their financial burden relieved.

By the way, regarding “free college”, there is no such thing, and it amazes me that people can still be sold on that idea. If a student goes to college and doesn’t pay tuition, someone else has to, and that’s the taxpayer. Then when that student graduates and gets a job, they become a taxpayer and will then be paying for someone else’s tuition. Either way, you pay. There’s no free lunch.

Housing

The housing market remains a bright spot. Since just before COVID, housing starts, permits, new home sales, and existing home sales are up 79%, 60%, 48%, and 73% respectively. All four measures are near 14-year highs. Supplies of existing homes for sale are at a record low of 1.9 months vs. the long term average of 5.7 months. Supplies of new homes for sale were at a record low of 3.5 months in September and although they have come back up to 4.1, that’s still well below the long-term average of 6.1 months. Prices of existing homes are up 15% since before COVID.

Covid

Every single topic you just read about has been driven by COVID, and that will continue to be the case for some time. So let’s review the current situation again.

The big problem is getting the vaccines administered. At this moment, 39,892,400 doses have been distributed but only 19,107,959 have been administered – 49%. That’s bad but it is a huge improvement over just last week when it was 35%. Amazingly, part of the problem is that many health care workers are refusing the vaccine:

This chart shows that in the US, the number of doses administered equals 5.3% of the population (most have received only one dose). We are better than the world average of 0.73%, but nowhere near Israel with its centralized medical system, getting 39% of the population at least one dose.

We are quickly getting much better at administering the doses, now at a rate of 913,912 per day, which is up 142% in two weeks. Not to throw cold water on the new administration, but its much-touted goal of administering 100 million vaccines in 100 days isn’t much of a goal since that’s what we’re doing already. The current rate only gets us to herd immunity (assuming we need 75% of the population to take 2 shots) in a miserable 1.5 years. If we double the rate to 2 million per day, we get there in 0.7 years.
New cases in the US are on the downswing, for now. But looking at the roller coaster over the past few weeks demonstrates that a down trend can reverse very quickly.
New cases per million once again shows we aren’t the worst in the world, and it shows that Spain is having a horrendous spike, and finally it shows that the UK’s recent third lockdown seems to have worked…
…but only after a few very grim weeks (deaths per million)
The positivity rate in the US is still very high as shown by the thick red line. But note the plunge in the UK represented by the thin purple line.

Here’s an interesting estimate on the cost of the pandemic. The purely economic damage as measured by GDP is less than half the total. If you’re wondering how they came up with these numbers you can find it here:

To summarize, stimulus, particularly income support, will help in the short term boosting 2021 GDP to a very strong 4.1% annual growth rate, but it will hurt growth in the long term. Retail sales have been terrible except for e-commerce. Student debt is going to get dumped on the taxpayers. Housing however is very strong, and there are several other pockets of strength that I will cover another time – it’s not all bad really. Finally, COVID is driving everything and will be for some time. The administration of the vaccine must pick up for us to recover more quickly this year.
We're always producing new content to help businesses understand economic trends and navigate trade uncertainty.
Sign up for our newsletters to make sure you don't miss anything.