"Base Effect" is Distorting Some Recent Data

Dan North | June 2, 2021

The economy is in very good condition and we expect an unusually strong GDP growth rate of 6.3% for all of 2021, the fastest in over three decades. Clearly, the combination of massive stimulus resulting in plenty of consumer firepower, plus the emergence of warmer weather, plus the lessening of the threat of Covid will drive the economy rapidly forward.

However, some recent economic news, such as the May 2021 Personal Income (PI) report, has given a “head fake” which might cause some concern that the economy might not really be on a roll. This head fake is a distortion caused by the “base effect” and I’m going to take a little time to explain it.

Here’s a very simple example. Say you have two bamboo stalks and each grows 1 inch in a day. The first stalk was only 1 inch tall to start with, so when it grew another inch, in percentage terms, it grew 100%. The second stalk was 100 inches tall to start with, so when it grew another inch, in percentage terms, it grew only 1%. It’s the beginning number or the “base” which can distort or mislead.

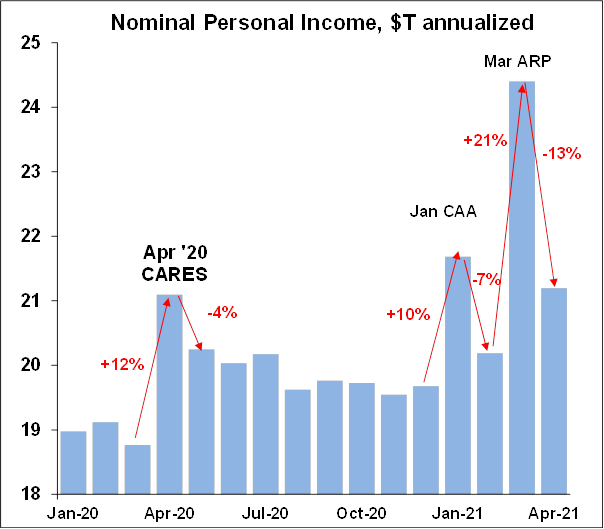
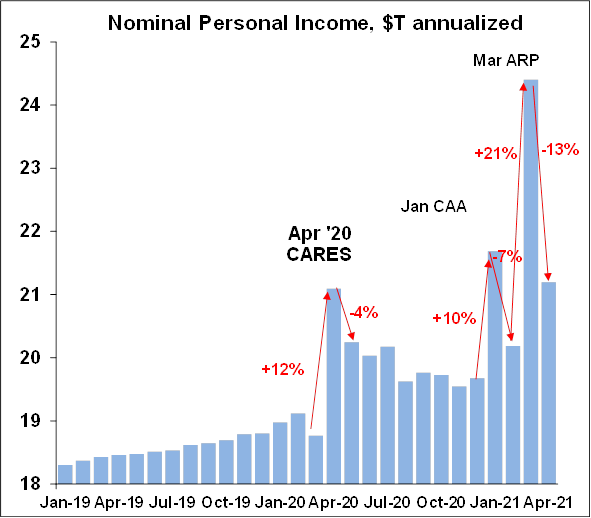
That’s what happened in the PI report. There have been three major fiscal stimulus programs since the pandemic; the CARES act of April ’20 which injected $2T in the  economy, the CAA in December ’20 which injected another $1T, and the most recent ARP which injected still another $2T into the economy. During those months there were huge spikes in personal income. But immediately before and immediately after those spikes, income fell – there was no fiscal boost in those months.

The chart below shows the evolution of PI since the beginning of 2020. On the left, you can see the big 12% boost in PI from CARES in April 2020. Since there was no boost in May 2020, PI fell 4% compared to April. In January 2021, the CAA increased PI by a steep 10%, but then since there was no boost in February, PI fell 7%. Finally, in March 2021, ARP boosted PI by a massive 21%, which of course was followed by this month’s 13% decline. These large percentage changes are a result of either very high or very low base levels from the previous month.

Here’s another way to look at it.  PI fell 13% in April which should be disastrous, right?  But look how much it is compared to a slightly longer history - it’s still much higher than it was in 2019.
This base effect has been wreaking havoc with a lot of economic data recently. May’s Personal Consumption Expenditures (PCE) report was a measly +0.5%, but that was compared to last month (April) which was boosted by all those stimulus checks from ARP. Compared to 2019, it’s substantially higher. Note the big swings in early 2020 from the base effect.
Last month (April) I raved about the retail sales report which showed an 11% increase in March compared to February. But in April, retail sales didn’t grow at all compared to March. So is the April report any less rave-worthy? Not if you compare it to how much higher it is than before the pandemic… more base effect at work.

Manufacturing

Manufacturing continues to be white-hot, according to the ISM index. The charts tell the story. The total index is in the top 10% of all readings over the past 73 years. New orders are just off a 17 year high and backorders are at a record high – that is work in the pipeline that will support the economy going forward for some time. The second chart is equally revealing as it shows a surge in prices paid, which is caused in part by the bottlenecks shown by supplier deliveries. And the biggest component holding the total down is that the respondents are all saying their customer inventories are too low. It all fits… supply constraints are slowing deliveries and raising prices, and buyers can’t get goods. The comments from the survey are included below and show that while demand in manufacturing is white-hot, supply chain disruption, inability to get raw materials, and a lack of labor are wreaking havoc on the industry. Imagine the growth if those conditions could see some relief.

  • “Supplier performance — deliveries, quality, it’s all suffering. Demand is high, and we are struggling to find employees to help us keep up.” [Computer & Electronic Products]
  • “Changes in currency exchange rates favorably contributed to our quarterly performance. Continued strong consumer demand for our high-quality products also provided increased sales.” [Chemical Products]
  • “Ongoing component shortages are driving dual sourcing and longer-term supply plans to be implemented.” [Transportation Equipment]
  • “Difficulty finding workers at the factory and warehouse level is not only impacting our production, but suppliers’ as well: Spot shortages and delays are common due to an inability to staff lines. Delays at the port continue to strain inventory levels.” [Food, Beverage & Tobacco Products]
  • “[A] lack of qualified candidates to fill both open office and shop positions is having a negative impact on production throughput. Challenges mounting for meeting delivery dates to customers due to material and services shortages and protracted lead times. This situation does not look to improve until possibly the fourth quarter of 2021 or beyond.” [Fabricated Metal Products]
  • “Labor shortages impacting internal and supplier production. Logistics performance is terrible.” [Electrical Equipment, Appliances & Components]
  • “Business is good, but labor and raw materials are becoming very problematic, driving increases in costs.” [Furniture & Related Products]
  • “The continued global supply chain tightness and raw material shortages from the Gulf (winter storms) make it less likely that any business can recover this year. Demand is strong, but what good is that if you cannot get the materials needed to produce your finished goods?” [Nonmetallic Mineral Products]
  • “Seeing a high demand and backlog of orders.” [Plastics & Rubber Products]
  • “Very busy, but still experiencing labor shortages.” [Primary Metals]

Friday June 4 is the all-important employment report. Hopes are that it will rebound from a dismal performance last month and produce 500k-1 million jobs.

We're always producing new content to help businesses understand economic trends and navigate trade uncertainty.
Sign up for our newsletters to make sure you don't miss anything.