Executive Summary
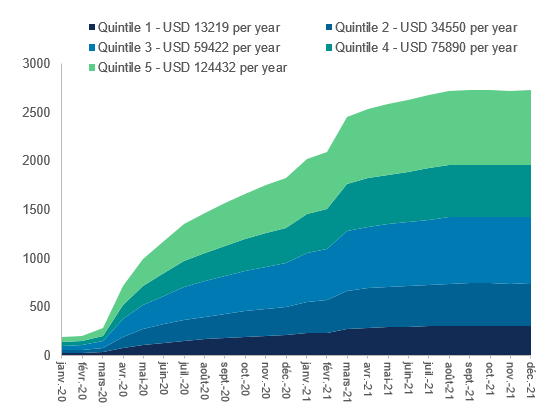
- The US economy is less directly exposed to the economic consequences of the invasion of Ukraine compared to Europe. But surging energy prices will drive inflation even higher (6.1% on average in 2022), accelerating the reversal of the "great resignation" as rising household expenses deplete the excess savings accumulated during the Covid-19 crisis (USD2.7trn). We expect the Fed to envisage only four hikes in 2022 and start reducing the size of its balance sheet from January 2023 only as lower excess savings, besides representing a diminishing tailwind for consumption, will be accompanied by higher jobs supply, therefore reducing the risk of a wage-price loop materializing in the US.
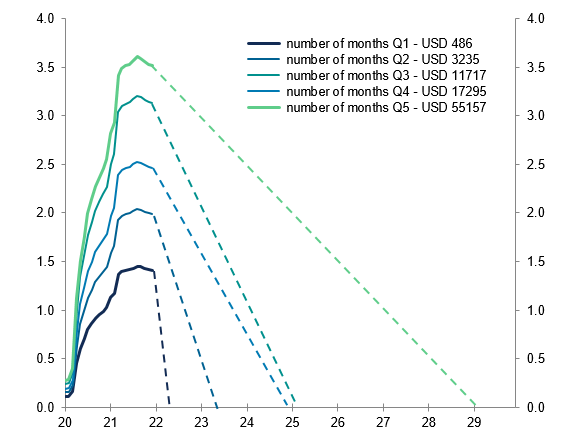
- Lower-income households would be forced to return to the job market first. We find that those with the lowest incomes (35% of total households) managed to accumulate 1.4 months of their average salary in excess savings (USD485). But with rising fixed expenses (+USD673 in 2022), these excess savings could be about to be fully depleted even sooner (3.3 months vs. 4.2 pre-war). In contrast, the wealthiest households hold more than 3.5 months of their average salary in excess savings, giving them more leeway to stay out of the job market.
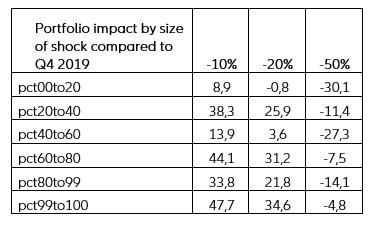
- Only a severe negative shock on wealth (a -50% negative correction on the current level of equity prices) would have the potential to significantly erode the top quintile’s excess savings.
- We estimate it will take two years to see a full normalization of the US job market, with the return of all 2mn missing workers. However, this normalization is likely to entail the higher participation rate of workers with lower educational attainment, offsetting the lower participation rate of elderly households, making life-long learning and the further education of the labor force particularly important.
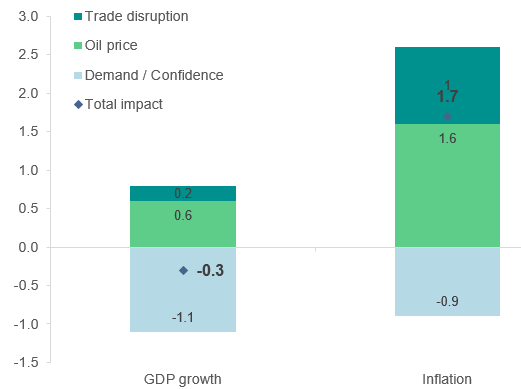
The US economy is less directly exposed to the economic consequences of the invasion of Ukraine compared to Europe. But surging energy prices will drive US inflation even higher, accelerating the reversal of the "great resignation" as rising household expenses deplete the excess savings accumulated during the Covid-19 crisis. The US economy is less directly exposed to imports from Russia (in particular oil & gas) compared to Europe but the geopolitical tensions will fuel uncertainties and price pressures in a context where inflation is already a major source of concern for US households. We estimate the consequences of the attack via the energy, trade and domestic demand channels will add an additional +1.7pp to US CPI inflation in 2022.
Figure 1 – Contribution to US GDP growth from energy, trade and confidence shocks arising from the invasion of Ukraine (pp)