Executive Summary

  • In response to the Covid-19 crisis, the debt-to-GDP ratio in advanced economies will rise to an all-time high of 130% of GDP this year. At the same time, long-term interest rates are at an all-time low.
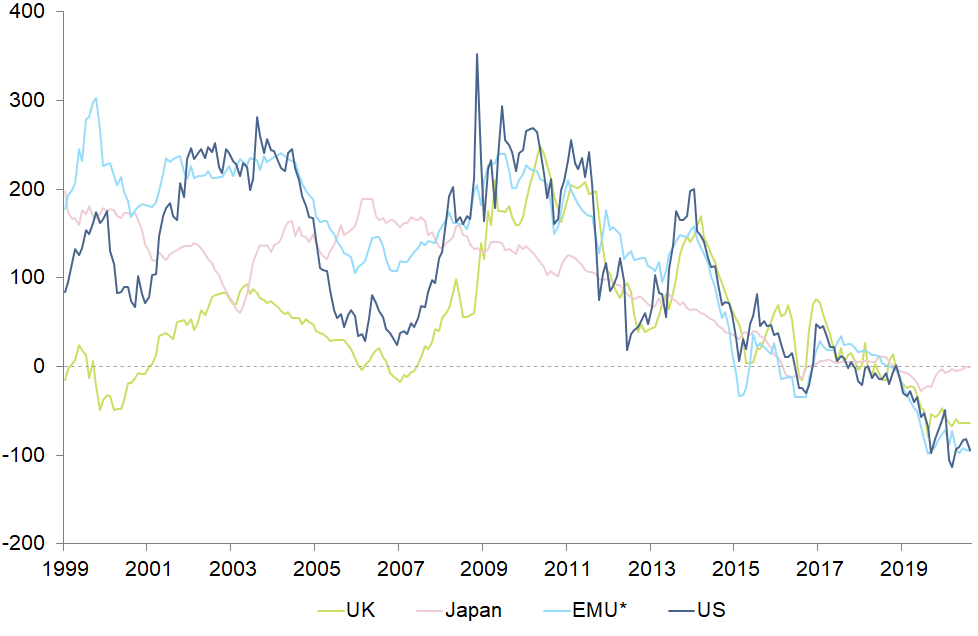
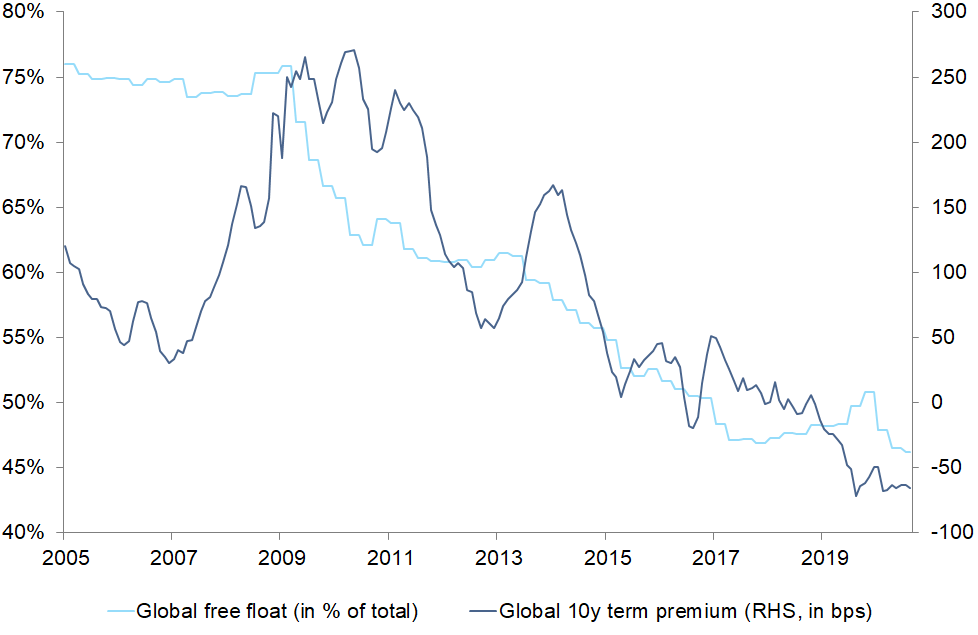
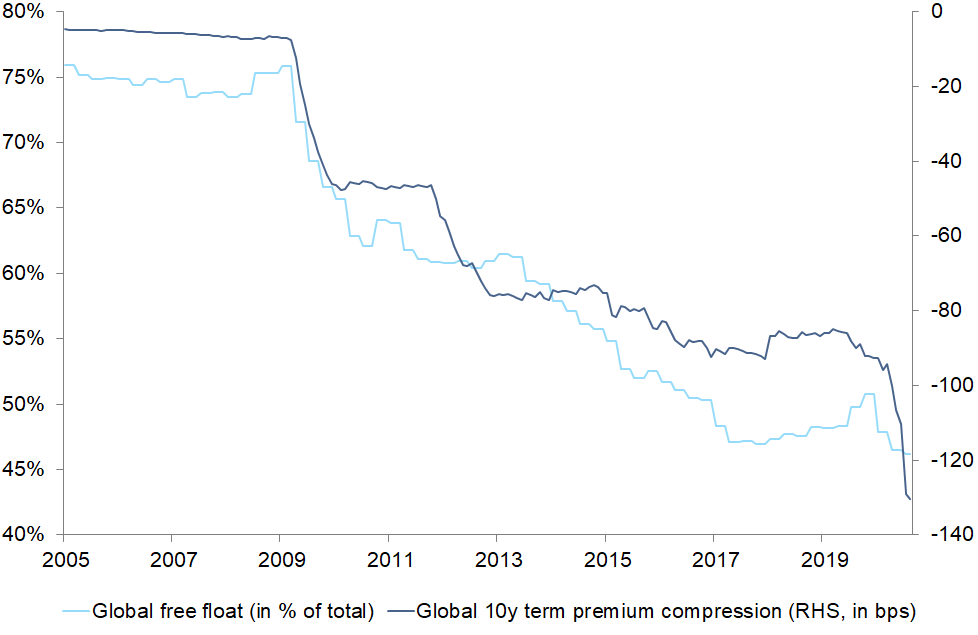
  • The decline in long-term interest rates is due in large part to the fall in the term premium. This has now turned negative globally. For the 10y maturity, we estimate the global term premium currently at -60bps.
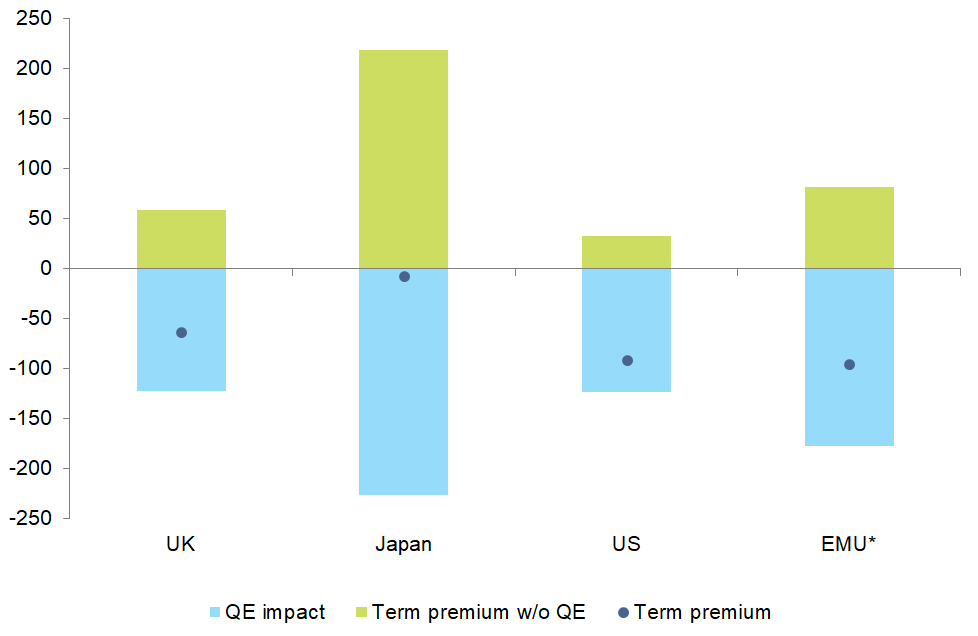
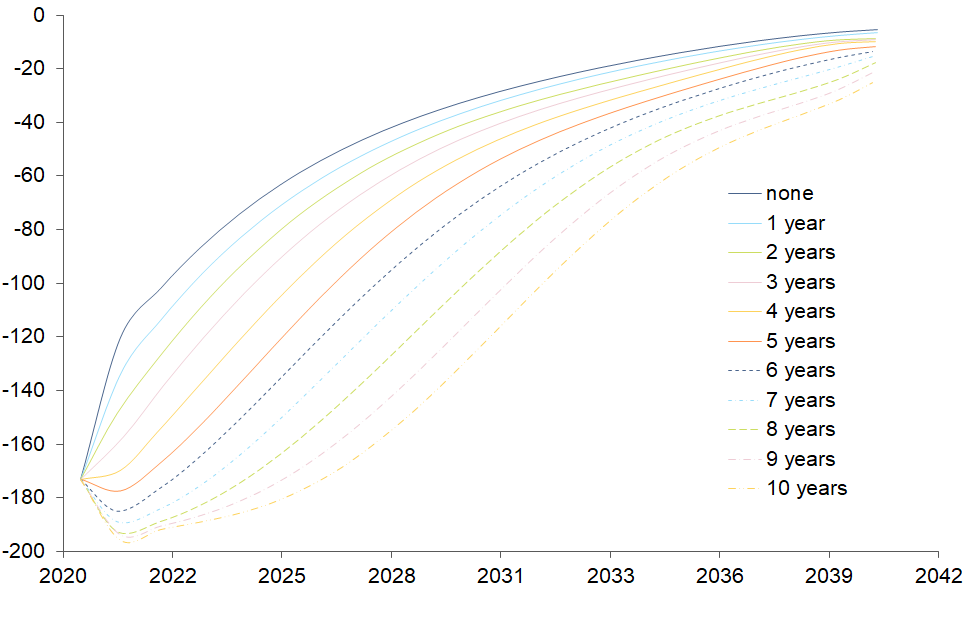
  • The inversion of the term premium from a receivable risk premium to a payable safety premium is due to the amplification of unconventional monetary policy (especially Quantitative Easing). We currently estimate the global term premium compression by central banks at -130bps. Depending on the aggressiveness of the current QE programs, it could reach up to -200bps by the end of 2021.
  • The yield-dampening effects of the term premium compression are long-term, since QE is followed by a phase of reinvestment.
  • This environment presents several challenges for investors, including an increasingly hybrid risk profile of safe government bonds, which reduces their diversification characteristics to risky assets, and the increasing loss of return potential through carry.
  • Possible responses are to compensate for the carry return with more duration (i.e. ultra-long bonds) or credit risk, or a more active management style to benefit from short-term dislocations on preferred curve segments.

A puzzle of premia - decomposition of nominal interest rates


The public response to the Covid-19 crisis has resulted in a massive and globally synchronized increase in sovereign debt, especially in advanced economies. This year, the debt-to-GDP ratio will reach an all-time high of 130%, even exceeding the level reached during World War II. This all-time high in public debt coincides with an all-time low for long-term government bond yields. The trend of falling interest rates has been going on for about 40 years, related to structural changes in demography and productivity (secular stagnation). However, since the 2008 Global Financial Crisis, unconventional monetary policy, especially large-scale bond purchases (Quantitative Easing), has also contributed to this downward trend. In this paper, we estimate the influence of central banks on government bond interest rates in advanced economies to show how sustainable this influence is, and how it should change the strategy of fixed income investors.

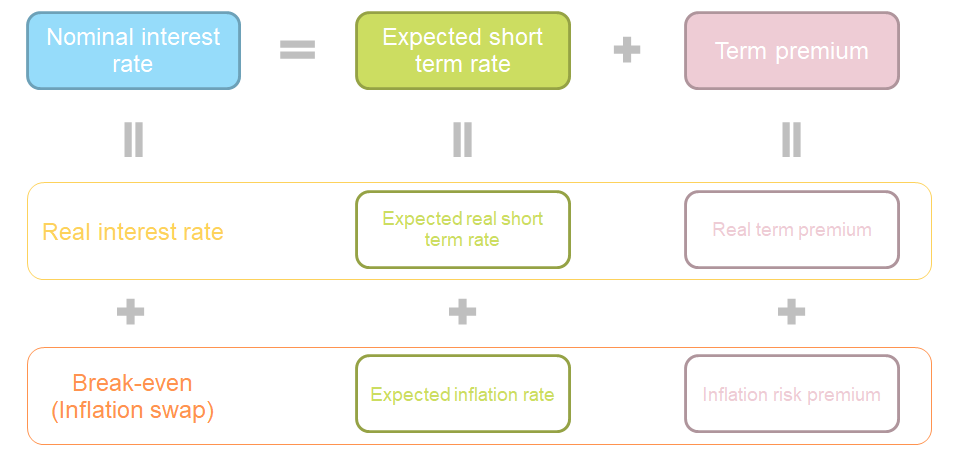
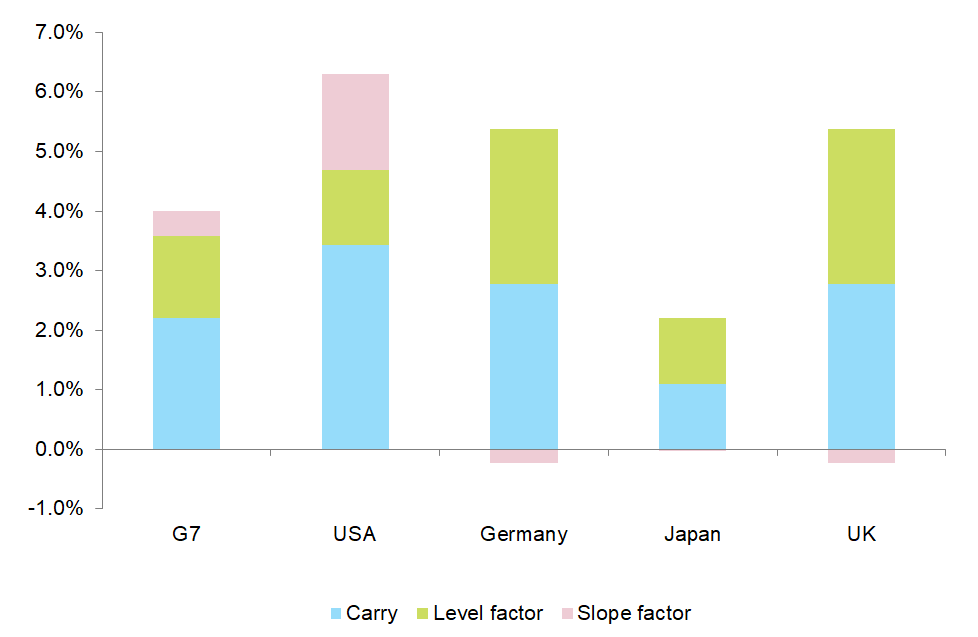
First, we have to break down nominal interest rates. We use a term structure model with two principal components: a level factor (expected short-term rate) and a slope factor (term premium) (see Figure 1). The term premium represents the investor’s risk reward for holding long-term bonds instead of a rolling investment in short-term interest rates. It is not to be confused with the simple steepness. The term premium is a risk premium that arises from the deviation of the actual term structure from a stylized term structure that reflects the so-called expectation hypothesis, which claims that yields on default-free government bonds should equal current and future short-term rates.

Figure 1: Term structure model – decomposition of nominal yields
 Figure 1: Term structure model – decomposition of nominal yields
Source: Allianz Research

Applying this term structure model to the sovereign yield curves of the U.S., the UK, the Eurozone and Japan, we observe that long-term rates (10y maturity) have fallen by around 500bps since 2002 (Figure 2). In the U.S. and the Eurozone, two thirds of this decline is explained by the contraction of the term premium; only one third only is explained by the fall in the interest rate level (expected short-term rate). In the UK, the ratios are inverted.

The clear exception is Japan. Here, long-term rates have remained largely constant as unconventional monetary policy has been in operation since 2001 and the broadest range of instruments (bond purchases, yield curve control etc.) is in use.

Figure 2: Contributions to change in 10y sovereign yields since 2002 (in bps)

Figure 2: Contributions to change in 10y sovereign yields since 2002 (in bps)
Sources: Refinitiv, Allianz Research

The inversion of the term premium

In a conventional framework, central bank steering is limited to the management of the key rate. In that case, the direct impact of monetary policy is limited to the level factor, i.e. the expected short-term rate. The determination of the term premium is left to financial markets translating the uncertainty about future inflation, real activity or the monetary stance into long-term yields. In an unconventional monetary framework, however, the central bank extends its influence on the slope factor, i.e. the term premium. This is mainly done by large-scale asset purchases (of mostly government bonds). The mechanism of term premium steering is called duration extraction and works as follows:  

By purchasing longer-term assets, the central bank takes duration risk out of the market. If not compensated for by an equivalent amount of new net issuance, the supply of long-term assets available on the markets, the so-called “free float”, decreases. Investors with a preference for longer maturities - for reasons of safety, liquidity or liability matching (preferred habitat) – then face a supply shortage of duration risk. The price for duration risk declines, which translates into a fall of long-term yields relative to short-term yields.  Accordingly, in the G4 (U.S., UK, Eurozone, Japan) - which accounts for 93% of the government bond volume in advanced economies - the term premium for 10y government bonds has therefore seen a clear downward trend at least since the financial crisis. Since mid-2018, it has generally turned negative (Figure 3).

Figure 3: Evolution of 10y term premia in advanced economies (in bps)

Figure 3: Evolution of 10y term premia in advanced economies (in bps)
Sources: Refinitiv, Allianz Research

This means that investors are now paying a premium for their long-term commitment instead of demanding compensation for the uncertainty regarding the evolution of expected short-term rates and inflation. In other words, investors are willing to pay a premium for the safety and/or their liability matching characteristics these bonds provide.

The question is, to what extent have QE programs contributed to the transition of the term premium from a receivable risk premium to a payable safety premium?

“The big compression” – the effect of QE on global term permia

We have seen that in the context of QE, term premia and free float are strongly intertwined. This is reflected in their simultaneous decline since the financial crisis. Despite the massive increase in public debt, the global free float has fallen from 80% in 2005 to below 50% today. In the same period, the global term premium (10y) has fallen from +200bps to -75bps. This means that, on average, for every 1pp decrease in the global free float, the global 10y term premium has been reduced by 9bps (Figure 4).

Figure 4: Global free float* and global term premium in coinciding decline since 2009

This means that investors are now paying a premium for their long-term commitment instead of demanding compensation for the uncertainty regarding the evolution of expected short-term rates and inflation. In other words, investors are willing to pay a premium for the safety and/or their liability matching characteristics these bonds provide.  The question is, to what extent have QE programs contributed to the transition of the term premium from a receivable risk premium to a payable safety premium?   “The big compression” – the effect of QE on global term permia  We have seen that in the context of QE, term premia and free float are strongly intertwined. This is reflected in their simultaneous decline since the financial crisis. Despite the massive increase in public debt, the global free float has fallen from 80% in 2005 to below 50% today. In the same period, the global term premium (10y) has fallen from +200bps to -75bps. This means that, on average, for every 1pp decrease in the global free float, the global 10y term premium has been reduced by 9bps (Figure 4).  Figure 4: Global free float* and global term premium in coinciding decline since 2009
Sources: Refinitiv, BIS, IMF, Allianz Research

We use a narrow definition of free float as the part of the outstanding long-term (maturity >1y) central government bonds that are not held by the domestic central bank for monetary policy or by foreign central banks for foreign exchange reserve management. We observe major differences in the free float estimates among advanced economies, reflecting the extent of QE deployed and the reserve currency status, Japan exhibits the lowest free float with 35%, while Switzerland has the highest with 85%. In the U.S. and the Eurozone, the free float is slightly below 50%. In the case of the Eurozone, however, there are major discrepancies among the member states, with Italy’s free float estimated at 68% while in Germany it is only 23% (Figure 5).

Figure 5: Estimated free float of long-term central government bonds (in % of total)

This means that investors are now paying a premium for their long-term commitment instead of demanding compensation for the uncertainty regarding the evolution of expected short-term rates and inflation. In other words, investors are willing to pay a premium for the safety and/or their liability matching characteristics these bonds provide.  The question is, to what extent have QE programs contributed to the transition of the term premium from a receivable risk premium to a payable safety premium?   “The big compression” – the effect of QE on global term permia  We have seen that in the context of QE, term premia and free float are strongly intertwined. This is reflected in their simultaneous decline since the financial crisis. Despite the massive increase in public debt, the global free float has fallen from 80% in 2005 to below 50% today. In the same period, the global term premium (10y) has fallen from +200bps to -75bps. This means that, on average, for every 1pp decrease in the global free float, the global 10y term premium has been reduced by 9bps (Figure 4).  Figure 4: Global free float* and global term premium in coinciding decline since 2009
Sources: Refinitiv, BIS, IMF, Allianz Research

To evaluate the contribution of QE to the term premium decline, we augment our initial term structure model by our free float estimates as a quantity factor. By comparing the time series fit before and after the pricing in of large asset purchases, we derive the QE impact.  We see that for the U.S. and UK, the dampening effect on the 10y term premium is currently around -130bps resp. -145bps. For the Eurozone it reaches -185bp. In Japan, the country with the longest history of QE and the lowest free float (35%), the dampening effect is even -220bps (Figure 6).

Figure 6:  Term premium compression by QE for advanced economies

Figure 6:  Term premium compression by QE for advanced economies
Sources: Refinitiv, Allianz Research

At a global level, the duration extraction of central banks amounts to -130bp for the 10y term premium. Depending on how aggressively the current round of QE continues, and how the issuance of long-term bonds develops, the global effect could reach -150bps by the end of the year and up to -200bps end of 2021 (Figure 7).

Figure 7: Global 10y term premium compression and global free float*

Figure 7: Global 10y term premium compression and global free float*
Sources: Refinitiv, Allianz Research
Now that we have isolated the QE effect on the term premium, we see that even without QE the term premium would have been on a structural downward trend. However, it would still be in positive territory for the 10y maturity, with 30bps in the U.S. and 80bps in Eurozone (Figure 8). The transition of the term premium from a receivable risk premium to a payable safety premium is thus indeed linked to the amplification of QE. This transition certainly makes sense from a monetary policy point of view as it increases the price for risk-free savings and creates an incentive for investing in other riskier market segments, easing financing conditions there. From a fiscal perspective, it contributes to ensure public debt sustainability.

Figure 8: Current QE induced distortion of the 10y term premium
Sources: Refinitiv, Allianz Research

Term premia compression is here to stay

But these are also the reasons why the term premium compression should last for a long time and will not be reversed quickly once a QE program terminates.  We have already seen that central banks enter a phase of full portfolio reinvestment after terminated net asset purchases (i.e. Fed) Otherwise the bond portfolio would immediately start to shrink as bonds mature. This would be equivalent to reinjecting duration risk in the market, which would then lead to a lower price of duration risk, higher interest rates and a tightening of monetary conditions. A calculation for the Eurozone shows that if the ECB stopped buying bonds today and did not reinvest, there would be an upwards pressure on the 10y yields of 60bps within 12 months. With a reinvestment period of three years, however, this upwards pressure could be contained at 20bps only (Figure 9). We also see that it will take around 15 to 20 years until the dampening effects of the current QE program on the 10y term premium will have become insignificant.

Figure 9: Evolution of Eurozone 10y term premium compression after end of QE for different reinvestment horizons (as of August 2020)

Figure 9: Evolution of Eurozone 10y term premium compression after end of QE for different reinvestment horizons (as of August 2020)
Sources: ECB, Refinitiv, Allianz Research

For fixed income investors this environment is a challenge for several reasons: The available share of the global supply of safe government bonds has never been smaller (48% global free float) and the level and slope of the curve are increasingly limited in their ability to generate returns (record low interest rates, downward distorted term premium). The information usually contained in nominal yields is blurring its predictive power for debt sustainability and the economic cycle (curve steepness). But the most challenging aspect is the lasting change in the risk-return profile, especially in the safe government bonds of advanced economies.

The risky asymmetry - towards a hybrid risk profile

Let’s turn to the risk side first. With the current low interest rate level, safe government bonds get in closer proximity to the effective lower bound, especially if they already trade at negative yields. This limits the potential for negative yield changes (i.e. positive changes in price). This asymmetry creates an increasingly hybrid risk profile. On the one hand, they exhibit low volatility, but simultaneously show augmented higher distribution moments such as skewness.

This pattern is shown in Figure 10. The greater the downward potential of the yield changes, the less skewed they are. Note that the positive skew depicted here is due to the fact that we observe yield changes rather than price changes (a positive skew in the distribution of yield changes translates into negative skew for prices changes).

Figure 10: Relationship between yield downside potential and skewness*

Figure 10: Relationship between yield downside potential and skewness*
Source: Allianz Research

We can already observe this hybrid risk profile in long-term Japanese government bonds. Their return distribution since 2000 shows low volatility but high negative skewness (Figure 11).  We can also see that compared to the period from 2000 to 2008, the risk profile of UK, U.S. and German long-term government bonds is continuously shifting to the hybrid territory.

Figure 11: Risk profile of different asset classes since 2000

Figure 11: Risk profile of different asset classes since 2000
Sources: Refinitiv, Allianz Research

This has negative implications on the diversification potential of global long-term government bonds. The more hybrid the risk profile, the lesser the inverse relationship to stocks. The ability of safe government bonds to cushion risky asset sell-offs is thus weakened. This requires new techniques in portfolio risk management as traditional correlation patterns can no longer be relied upon.

“Farewell good friend !” – the decline of the carry

On the return side, it has been possible over the last 15 years to achieve decent returns on safe government bonds with a simple hold-to-maturity strategy by exploiting the “carry over time” . In this period, long-term G7 government bonds provided a 4% p.a. return, of which 2.2% was attributable to the carry. This is more than the combined contribution of the level and slope factors together. The picture is similar for the U.S., Germany, the UK and Japan: everywhere the carry contributes about 50% to the total return (Figure 12).

Figure 12: Return attribution for long-term government bonds* (total return p.a., since 2005)

Figure 12: Return attribution for long-term government bonds* (total return p.a., since 2005)
Sources: Refinitiv, Allianz Research

However, since the nominal coupons continue to fall together with the interest rate level (for long-term G7 government bonds, par weighted coupons fell from 3.8% in 2005 to 1.8% currently), the return potential of the time-dependent carry declines. Accordingly, investors will have to increase their exposure to the market-dependent factors (e.g. level and slope) if they wish to maintain their return potential. Investors can incorporate this new paradigm in different ways in their strategies depending on how strongly determined their preferred habitat is.

Flexible investors might either increase the potential of the shift and especially the slope factor by adding duration risk via exposure to ultra-long bonds (+30y). Alternatively, they might try to increase the return potential by adding credit risk (spread) as an additional return component.

For liability driven investors, the costs of maturity mismatches might exceed the cost induced by the negative term premium. They might therefore not be willing to make large duration bets. Their investment strategy might shift to a more active management style, taking advantage of short-term volatility in their preferred segments of the curve. But both changes in the investment strategy are structurally associated with higher risks and volatility. The days of placid fixed income management are gone.

Patrick Krizan
Senior Economist, Fixed Income