Several factors point to reflation in 2021-2022, with a temporary overshooting ahead in the US and the Eurozone. Is this good news for equity markets? Financial markets have been pricing an inflation risk premium based on (i) the recent input cost bonanza, (ii) higher services inflation along with the economic reopening in H2 and (iii) strong pandemic-related roller coaster base effects. While the risk of an inflationary scenario cannot be excluded, we don't see inflation embarking on a structural regime change as subdued demand dynamics point to a potential head fake: (i) excess savings from households and non-financial corporations that act as a drag on money velocity; (ii) persistently negative output gaps due to lower capacity utilization; (iii) somewhat high unemployment rates will keeping a lid on wage growth (below 3%) and (iv) the negative impact on companies’ balance sheets from the phasing out of assistance mechanisms.

Historically, monetary and fiscal easing periods tend to be favorable for equity investors as equity tends to generate decent returns in periods of accelerating, but still manageable, reflationary pressures. From a pure fundamental perspective, it can be inferred that as long as the interest rate used to discount future profits rises less than the increase in inflation rates, the net impact of higher inflation on the present value of future cash flows should be positive. Of course, this direct inference assumes inflation as a positive contributor to earnings, that is to say in industrial companies CPI > PPI and that this triggers an acceleration in global consumption and in turn global growth. All in all, it means that as long as inflation is “benign” and that it remains outside tail values, be it “too high” or “too low”, it should support equities.

But is realized inflation the relevant metric? By simply eyeballing some inflation vs. equity charts, it can be derived that realized inflation rates, that is to say historical CPI growth rates, tend to lag behind market moves and are not coincident with abrupt market swings. This divergence is not only because of a publication delay but also due to markets front-running inflation. This suggests that the metric has a poor explanatory power for equity market returns from a tactical perspective (especially at the tails of the equity return distribution). Additionally, over long periods, one can observe an inverse U-shaped relationship between equity valuations and inflation rates, meaning that equity multiples tend to be low when inflation rates are “too high” / “too low” and they seem to have a sweet spot in between. This is especially true since extreme inflation scenarios tend to lead to elevated volatility as uncertainty skyrockets and market participants start pricing in a wider range of outcomes. This negative relationship at the tail, i.e. the more uncertain part of the inflation distribution bell curve, has been well documented through history.  

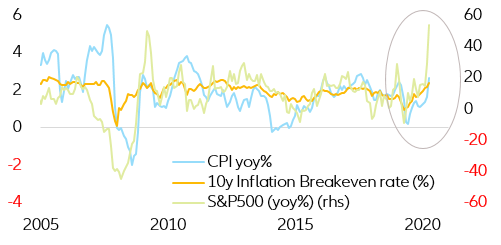
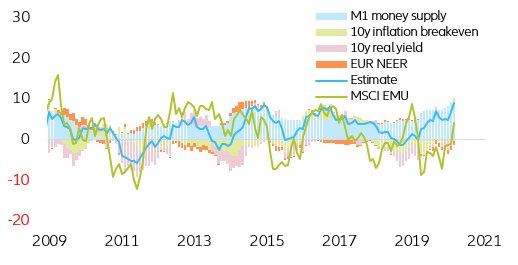
In this context, it is more appropriate to look at market pricing of inflation expectations as the embedded traded nature of this inflation measure makes it reactive to changes in investors’ expectations. With 2020 not being an outlier in this relationship, the extreme market swings in equity markets during the year and especially in 2021 have, as expected, coincided with changes in long-term market-based inflation expectations as market participants traded on increasing reflationary expectations (Figure 1).

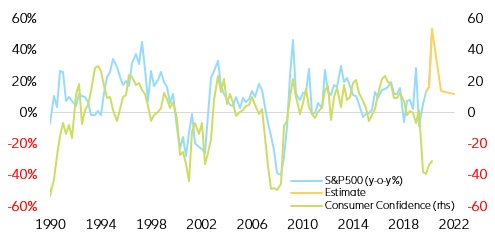
Figure 1: US realized and market-based inflation vs equity (in % - y/y%)
 Figure 1: US realized and market-based inflation vs equity (in % - yoy%)
Sources: Refinitiv, Allianz Research. 
Consequently, and with the aim of seeing the forest for the trees, it is appropriate to look at current valuations of market-based inflation expectations to assess how much room inflation expectations have to maneuver and what is the most likely path moving forward.

How much more can market inflation expectations go up? Our proprietary model for 10y US breakeven inflation rates based on the direct relationship between realized monthly inflation rates (smoothed) and market-based inflation expectations currently suggests that, trading at 2.5%, 10y US inflation expectations lie more than one standard deviation above their underlying fair value (currently estimated at 1.6%). Following this premise, and under the combination of the model’s mean reverting properties and the economic reasons mentioned above, we do not expect the current inflation expectations overshoot to be structural or long-lasting. Consequently, we believe US long-term market-based inflation expectations have little remaining upside potential and are bound for a reversion in 2021 (Figure 2).  

Figure 2: US 10y Breakeven inflation rates (in y/y%)
Figure 2: US 10y Breakeven inflation rates (in yoy%)
Sources: Refinitiv, Allianz Research. The model depicts 10y breakeven inflation rates as a function of realized inflation.
Applying the same methodology to EUR long-term market-based inflation expectations, our proprietary model shows that, at 1.4-1.5%, 10y EUR inflation expectations are close to reaching the upper bound limit of our model’s fair value (currently estimated at 1.3%) after two consecutive years of persistent undershooting. With that in mind and due to the different initial conditions between the two regions, a +10 to 20bps temporary increase in long-term EUR inflation expectations can be easily penciled in should the term premium-driven rally on US rates continue for some time (Figure 3).

Figure 3: EUR 10y Swap Breakeven inflation rates (in y/y%)
Figure 3: EUR 10y Swap Breakeven inflation rates (in yoy%)
Sources: Refinitiv, Allianz Research. The model depicts 10y breakeven inflation rates as a function of realized inflation.
How much did inflation expectations impact equity performance in 2020? Trying to explain equity performance using macro factors is always a tricky business, because it assumes that all market participants take into account the same variables when looking at capital markets and that they trade under the same information. Nevertheless, such a top-down approach helps bring some light on the relative importance of certain broad economic factors on equity returns. In this specific case, we approximate equity performance using a monetary aggregate, long-term inflation expectations, real yields and nominal exchange rates. This multivariate approach works best in the US but allows for some information extraction in the Eurozone. (Figure 4)

Figure 4: S&P500 yearly return decomposition (in y/y%)
Sources: Refinitiv, Allianz Research. 
Our model shows that M2 money supply seems to be responsible for the biggest part of the 2020 equity rally by exerting an almost constant +10pp upside pressure on yearly equity returns since April 2020.  Real yields, on the other hand, have been exerting downside pressure on equity returns of the order of -2 to -3pp since the beginning of 2020 but are starting to reverse . Lastly, the inflation component, which exerted extreme downside pressures right after the initial March 2020 shock (-8pp), has finally turned positive, managing to reach +7.5pp upside pressure in February 2021. Overall, the coefficient attached to the inflation component is structurally positive, meaning that higher inflation expectations should lead to higher equity returns.

For the Eurozone, the model fit is far less accurate but the underlying message remains similar. The increase in the monetary component accounts for +7pp of yearly equity return, with the currency component having little impact on the overall market performance. Additionally, real yields keep adding negative pressures to performance despite starting to fade away. Lastly, the inflation expectations component has recently turned positive, adding ~2pp of upside pressures to the yearly equity performance (Figure 5).

Figure 5: MSCI EMU return decomposition (in y/y%)
Sources: Refinitiv, Allianz Research. 
This melting pot of indicators shows that for the market to continue its upward trend, tapering talks have to wait until the real component turns positive and mitigates the effect of a declining monetary component and stabilizing inflation expectations. With this equity component breakdown in mind and inputting our inflation expectations valuation metric into the model, it becomes clear that monetary policy has to remain highly accommodative for as long as real economic growth does not manage to catch up. By being prudent in its policy normalization policymakers will implicitly prevent a global equity market accident.

What about real economic growth? In the current volatile market context, it is important to understand the link between the real economic performance and equity returns. In order to estimate this link, and avoid the structural lag between GDP growth and equity returns, we establish a direct relationship that runs from real GDP growth to consumer confidence to equity returns. By setting consumer confidence as the intermediary step, we manage to capture the variance of market-based economic expectations while being able to capture the structural real growth outlook. Keeping this framework in mind, our US real growth recovery path signals that the S&P500 should reach recovery speeds last seen in 2009 and should stabilize at a +10% yearly return in 2022 (Figure 6).

Figure 6: US consumer confidence and equity returns (in y/y%)
Sources: Refinitiv, Allianz Research. 
In other words, should the real-GDP-to-equity-return dynamics remain intact throughout the forecasting period, US equity markets are set to resume the upward sloping trend they have been following since mid-2010 (Figure 7).

Figure 7: US implied equity performance (in USD)
Sources: Refinitiv, Allianz Research. 
In the case of the Eurozone, the same overarching story applies. Our current EMU real growth recovery path signals that the MSCI EMU is bound for a speedy recovery despite falling short of 2009 speeds. Right after this implied speedy recovery, equity returns should stabilize at a ~7% yearly return in 2022 (Figure 8).

Figure 8: EMU Consumer confidence and equity returns (in y/y%)
Sources: Refinitiv, Allianz Research. 
In this case, if the real-GDP-to-equity-return dynamics remain intact throughout the forecasting period, Eurozone equity markets are also set to resume the upward sloping trend they have been following since mid-2010, leaving the long-term trend intact. (Figure 9).

Figure 9: EUR implied equity performance (in EUR)
Sources: Refinitiv, Allianz Research. 

What does this mean for equity markets going forward? Although it would be extremely comfortable to take both models at face value and forecast double-digit equity returns for the next two years, the current economic and capital markets context does not grant this free pass. If history is of any guide, initial conditions matter and consequently the combination of extremely high valuation metrics (especially in the case of the US) and a complete dependence on monetary policy support leaves equity markets at an extremely fragile crossroads.

In this context and due to the fact that the US inflation component is estimated to be substantially overvalued, we believe the upside for US equities will remain capped for as long as the real economy does not substantially and structurally accelerate. On the other hand and despite EUR equity being less dependent on inflation than the US within our model scope, the EUR reflation trade has still some room to maneuver, being able to temporarily surpass the upper bound of our inflation expectations estimation and allowing for a limited EUR equity over performance on the back of a stronger temporary inflation overshoot and a stronger economic catch-up effect.

Because of this, we believe equity markets will have a timid positive performance in 2021 (upper single digit total returns in the EMU and lower single returns in the US) that will accelerate in 2022 on the back of a healthier and more stable growth and inflation outlook. At the same time, we expect monetary policy to remain in place due to the high market dependence and to suppress spikes in equity market volatility along the way for as long as there is no hard evidence of the structural growth stabilization.

When it comes to short-run developments, we expect inflation expectations developments to have a neutral to negative impact in the US while exerting a neutral impact in the Eurozone.  Following the same argument, we also expect the real economic recovery to have a positive impact on both sides of the pond, preventing equity returns from turning red in 2021. (Table 1)

Table 1: Baseline Impact - summary table

Table 1: Baseline Impact - Summary Table
Source: Allianz Research.