Could surging energy prices raise inflation expectations and spark a self-fulfilling upward price spiral? Futures markets suggest the risk is limited — for now. Sharply rising energy prices have accelerated headline inflation. After oil, gas and coal prices more than doubled in less than a year (see Figure 1), spurred by strong supply-demand imbalances and weather-related factors, there are growing concerns that inflation expectations might become increasingly influenced by current price pressures (“de-anchoring”), creating a challenging environment for monetary policy. Yet, futures prices of such commodities are currently in strong “backwardation” (i.e., they are lower than spot prices). Often overlooked, such backwardation suggests that the current energy crisis could be temporary, which may explain why professional long-term inflation expectations have remained relatively well-behaved so far — in contrast to market-implied inflation expectations (see Box 1).
However, there are emerging signs of de-anchoring inflation expectations if the energy crisis drags on for too long. Given the current uncertainty on the recovery path and inflation outlook, this places a premium on the credibility of central banks and their effective forward guidance to ensure that expectations remain well-anchored to avoid being cornered by markets anticipating possible inflation overshooting.
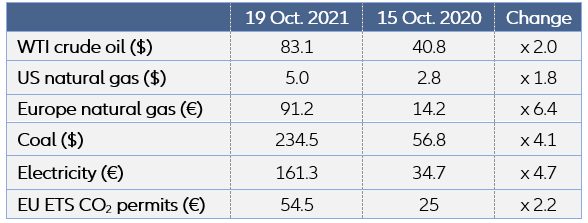
Figure 1 – Changes in selected energy prices
Sources: Refinitiv, Allianz Research.
Note: WTI= West Texas Intermediate, ETS=Emissions Trading System
The re-opening dynamics of the pandemic generated strong demand-supply imbalances in energy markets, whose price effect has been exacerbated by weather-related factors (read
here our latest report). In particular, the recent surge of natural gas prices (“gasflation”), and spillover effects to oil and coal, have amplified existing price pressures driven by firming demand and continued supply chain disruptions. While real activity and industrial production (which accounts for about one-third of global natural gas consumption) have been recovering swiftly, the supply side response has been modest, crippled by labor shortages, rising input costs, and delayed investment. At the same time, soaring gas prices prompted substantial switching to the use of coal in power generation in key markets, including in China, Europe and the United States, leading coal prices to their highest level since 2001 (+420% year-over-year), and causing CO2 emission prices to rise (as energy producers cover the higher emission intensity) (see Figure 2). They have also pushed up prices for crude oil as a substitute for heating and power generation. While gas is still 19% below its year-to-date peak, crude oil continues to reach new record YTD highs. A cold winter could make the situation worse, with the combination of low inventories and supply-chain disruptions pushing prices up further.
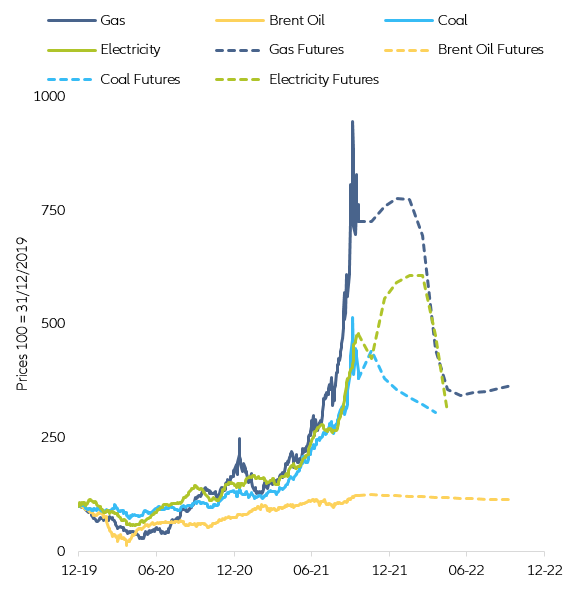
Figure 2 – European energy prices (indexed, December 2019 = 100)
Sources: Refinitiv, Allianz Research
Persistently high energy prices will present broader risks to economic activity, especially for vulnerable households and directly exposed sectors. Many businesses are likely to face the double impact of rising energy costs and a potential decline of consumer spending due to households’ increased energy-related expenses (IEA, 2021). Cost pressures are already impacting the operations of electricity-intensive industries, such as chemicals and fertilizers (which may negatively affect the next crop season and, thus, food prices). In addition, utilities might be squeezed between high input costs and regulated electricity prices, raising the risk of insolvency. Upside risks to oil prices are more limited (also due to more diversified supply) but will contribute to inflationary pressures, too. However, current gas spot prices are still below levels that would trigger an energy crisis comparable to the 1974 oil price shock (with larger effects on energy and manufacturing sectors rather than transportation) due to a smaller share of natural gas in primary energy generation and the use of long-term contract pricing (see Figure 3).
Figure 3 – Global energy demand (by source)
Sources: OECD, Refinitiv, Allianz Research
The scale and duration of current price pressures will weigh on how central banks assess and manage the risk of inflation becoming ingrained in the economy. Monetary policy works typically by raising or lowering aggregate economic demand. If spending grows too fast and generates inflation, higher interest rates make it more expensive to borrow, and, thus, dampen the overall willingness of companies and households to consume or invest. However, this approach is ill-suited when a negative supply side shock pushes up inflation due to higher input prices, broken supply chains or a tightening labor market. Normally, central banks tend to “look through” such cyclical price pressures given their belief that they will fade over time and will not affect their forward guidance on policy rates. The trouble arises when supply side-induced inflationary forces become persistent and create structurally higher inflation. Then, central banks have essentially no arrow in the quiver to target without the risk of choking off growth through uncessary tightening of monetary policy.
Given the uncertain outlook for energy prices, the key question is whether recent price increases could raise inflation expectations. Central banks are worried for good reasons. In the just released World Economic Outlook, the IMF warns central banks to be “very, very vigilant” and take early action to tighten monetary policy should price pressures prove persistent due to a prolonged resolution of supply-demand mismatches during the post-COVID-recovery period. Past experience suggests that sharp exchange-rate depreciations followed by large external imbalances could de-anchor inflation expectations, especially if central banks lack credibility in containing inflation. However, even without external shocks, this could also occur if energy prices cause inflation to overshoot their price stability target over a prolonged period of time. While energy prices are expected to slowly normalize, they may feed into inflation expectations. In the current situation, small shocks to demand and supply sides are likely to have a disproportionate impact on current and expected prices, such as the severity of the Northern Hemisphere winter, the pace of the economic recovery, and the magnitude of unplanned supply outages.
Gauging the potential impact of rising energy costs on inflation expectations requires a closer look at futures markets. Futures prices of both oil and gas have not risen as fast as spot prices and remain well below them over the near term. This “backwardation” in the term structure of energy futures suggests that spot prices are likely to decline early next year. However, under no arbitrage conditions, futures prices reflect the spot price plus the cost of carry (i.e., the sum of the financing cost and storage cost), and should thus normally be higher than the spot price and increase the further out their delivery date. For instance, a trader must buy some oil in the spot market and store it until the delivery date to hedge selling oil forward. And to buy some oil in the spot market, the trader must borrow money until the delivery date (“contango”). As the variation of the cost of carry is a second order factor, we would expect a 1-for-1 relationship between the changes in the futures and spot prices. However, John Hicks (1939) argued that, for commodities, futures prices should normally be lower than spot prices (“backwardation”). Hicks observed that the producers of a commodity have a strong incentive to hedge against a potential fall of its price by selling forward so as to secure their top line. In contrast, for the buyers of that commodity, its price is just one cost among many others. As the incentive to buy forward is not as strong as the incentive to sell forward, the forward supply of a commodity should systematically exceed its future demand, depressing futures prices relative to the spot price.
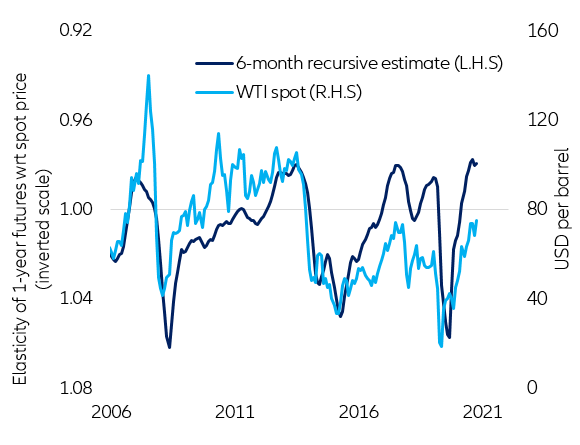
In the current situation, however, it is not the backwardation of energy futures per se but the intensity of such backwardation that deserves attention. As of 15 October 2021, the 12-month contracts on gas and oil traded at a discount of almost 20% and 10% relative to their spot prices. Over the last two decades, such backwardation of gas futures has never been stronger; similarly, for oil, futures have traded even lower in only one out of 7 cases. In addition, the spot price to the one-year forward price has become more elastic than ever before (see Figure 4 as an example for oil). In the past, strong backwardation coincided with a cyclical peak in oil and gas prices. Why is such a valuable piece of information seemingly overlooked or so little commented on?
A year ago, the one-year gas future was in a contango of 14%, while the one-year oil future was in a contango of 7%. A move from contango to backwardation is less prone to catching attention than a doubling of spot prices over the same period. As suggested by the “rational inattention” hypothesis (Sims, 2002), attention is a scarce resource. There is so much available information that people at large cannot be on top of things all the time. They have to choose how to allocate their attention. So it makes sense to allocate attention to what is (or has been) changing the most and is (or has been) the most volatile. As spot prices have risen faster than futures prices, we should expect the average person (helped by most of the media) to pay more attention to changes in the spot rather than in the futures prices of energy. By the same token, under uncertainty, necessarily backward-looking expectations are likely to become more and more dependent on the most recent movements in spot prices. Under uncertainty, one does not even know what cannot happen. Who would have bet on the oil price turn negative on 20 April 2020? This is the very kind of expectational dynamics that must now keep central bankers awake at night. There is, however, some evidence that not all people hold the same inflation expectations and that, maybe informed by the backwardation in energy futures, the long-term inflation expectations of capital markets and professional forecasters remain anchored.
Figure 4 – Elasticity of one-year futures and WTI spot prices
Sources: Refinitiv, Allianz Research
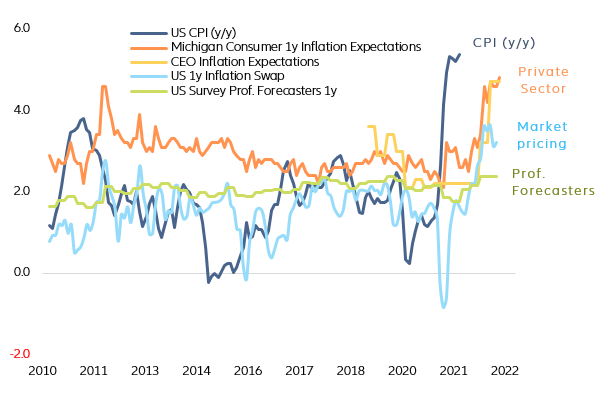
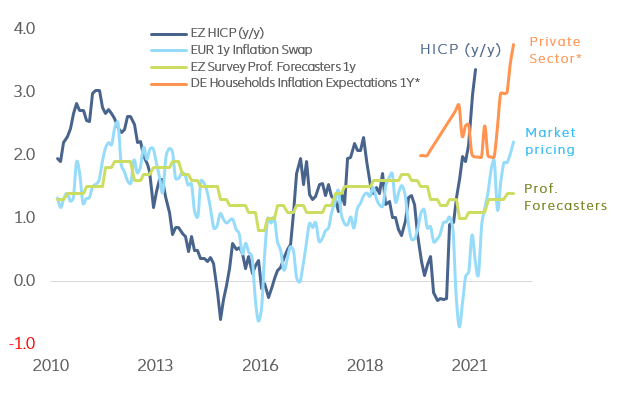
We assess whether inflation expectations remain anchored by examining changes in the cyclically adjusted (or “perceived”) rate of inflation relative to changes in current inflation and inflation expectations. One can generally distinguish two different types of inflation expectations: (i) short-term expectations, mostly from surveys of consumers and businesses and (ii) long-term expectations, which can come from either surveys of professional forecasters or be derived from inflation-linked capital market instruments, such as break-even inflation rates and inflation swap rates (minus an inflation risk premium, which is estimated to range between 30 and 60 bps) (see Figures 5 and 6). As short-term expectations are strongly correlated with current inflation (commonly on a y/y basis), they contain little information about the change of inflation expectations beyond the current cycle. For instance, consumer price expectations over the next twelve months are hardly forward-looking and tend to converge to the annual rate of headline inflation. Conversely, the median ten-year forecast for headline CPI made by professional forecasters tends to move in line with the perceived rate of inflation. Thus, we focus on long-term expectations in determining whether the current price pressures have a persistent impact on inflation dynamics. In addition, we also determine the elasticity of professional forecasts, breakeven inflation rates or inflation swap rates to realized inflation (through wavelet co-herence). Breakeven inflation rates and inflation swap rates tend to be more volatile than professional forecasts because they include an inflation risk premium on top of the “pure” long-term inflation expectations reflected in the perceived rate of inflation.
Figure 5 – US: Current inflation vs. short-term inflation expectations
Sources: Bernardo, Coibion and Gorodnichenko (2021), Refinitiv, Allianz Research
Figure 6 – Eurozone: Current inflation vs. short-term inflation expectations
Sources: Refinitiv, Allianz Research
Note: *Germany only.
In addition, as a shortcut, we also determine the elasticity of breakeven inflation rates or inflation swap rates to realized inflation. A comprehensive assessment of de-anchoring risks requires examining fluctuations of the breakeven inflation rate and inflation swap rate around the perceived rate of inflation. Breakeven inflation rates and inflation swap rates tend to be more volatile than professional forecasts because they include an inflation risk premium on top of the “pure” long-term inflation expectations reflected in the perceived rate of inflation. For instance, in the US, the breakeven inflation rate on 10-year US TIPS rose from 1.1% in April 2020 to 2.4% in September 2021 (and the 10-year USD inflation swap rate has risen from 1.3% to 2.6%), reflecting changes in an inflation risk premium rather than genuine changes in long-term inflation expectations. Thus, the cyclically-adjusted rate of inflation has risen only from 2.2% to 2.5% in the US since April 2020, while the annual rate of inflation has jumped by 510 basis points to 5.4%. This reflects the assumption, supported by empirical evidence, that people’s memory is context-dependent. When inflation has been low for many years, people’s memory goes far back into the past. In this situation, people update their knowledge slowly, and their expectations are quite inelastic.
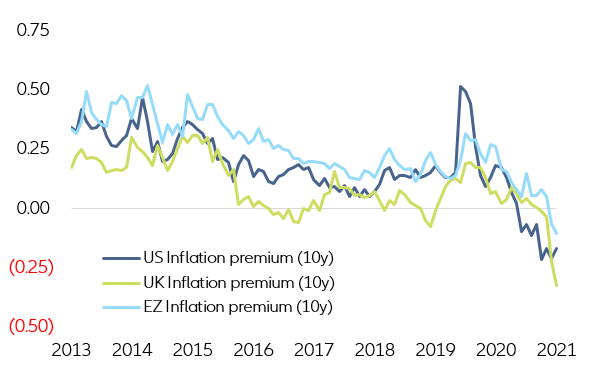
Figure 7 – Inflation premia (10-year swap vs 5-year/5-year forward, in %)
Sources: Refinitiv, Allianz Research
So far, the risk of spot energy prices causing inflation expectations to become un-anchored has been limited; however, there are signs of a weakening expectations channel. Model-based estimates suggest that market-implied inflation expectations now deviate significantly from the perceived rate of inflation, especially in the UK and the US, and to a lesser extent in the Eurozone. More specifically, we find the following:
• Rising prices have not become structurally embedded. Current inflation does not significantly explain changes in the perceived rate of inflation but has recently become more influential. The elasticity of the perceived rate of inflation with respect to realized inflation has remained low but is rising (though still far away from the theoretical maximum of one). Interestingly, the risk premium beyond the next five years has become negative, which implies that current inflation dynamics seem less associated with concerns about long-term inflation expectations (see Figure 7).
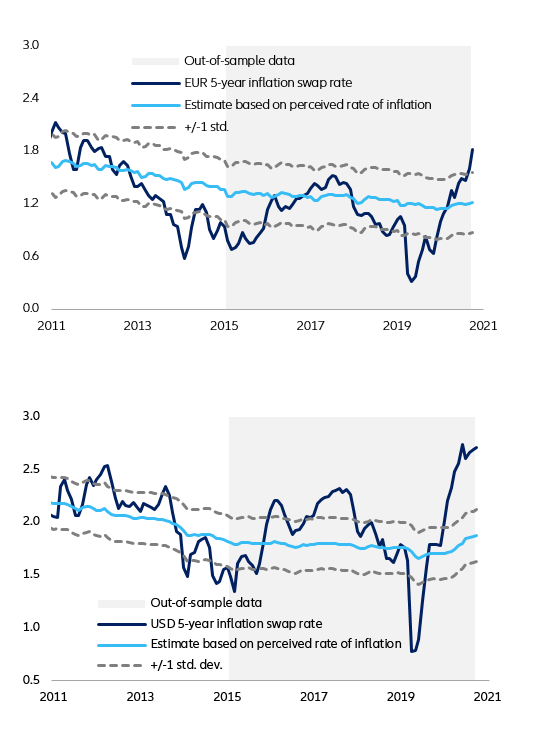
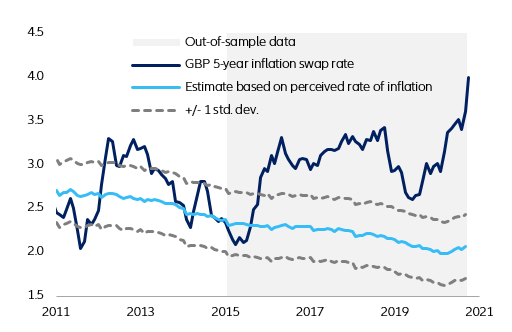
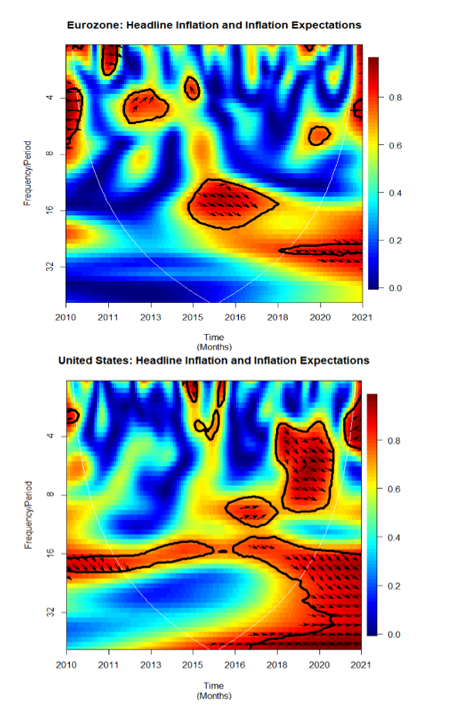
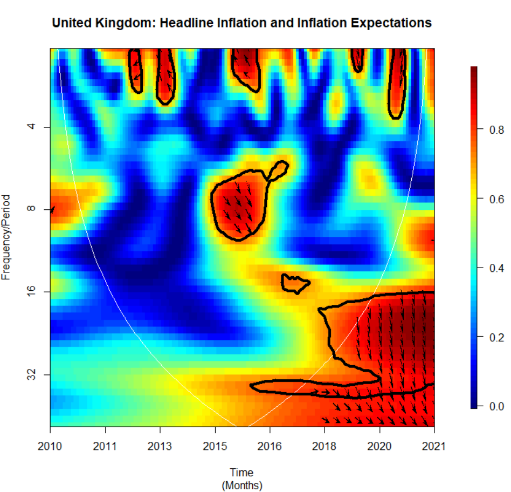
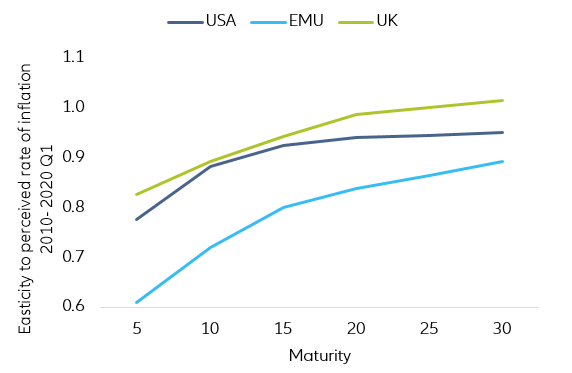
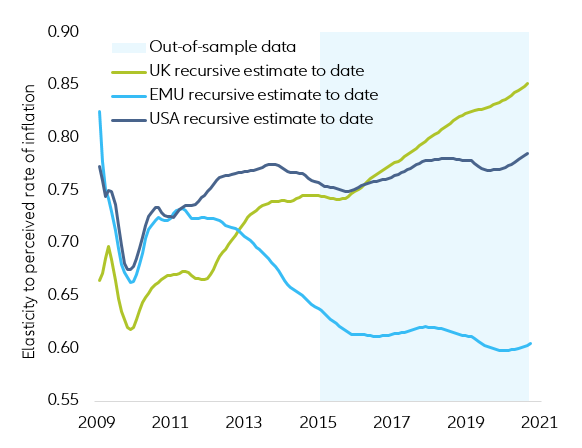
• Inflation expectations seem to have become more backward-looking in some countries. The elasticity of professional forecasts, breakeven inflation rates or inflation swap rates over a five-year horizon to the perceived rate of inflation has steadily increased since 2015 in the UK and the US, while the opposite is true for the Eurozone. Interestingly, in both countries, the median professional forecast for the long-term headline CPI (beyond five years) has increased more than warranted by the rise in the perceived rate of inflation, following several years prior to the Covid-19 crisis when it failed to track the preceived rate of inflation down (see Figure 8). The elasticity of market-implied inflation expectations to the perceived rate of inflation has also increased across the entire maturity spectrum (see Figures 10 and 11). In addition, the dependence between headline inflation and expected inflation has not only strengthened but has also become “tighter” and more regular in the frequency spectrum, which is indicated by stronger wavelet coherence (red-colored area), especially over shorter time periods (see Figure 9).
Figure 8 – Five-year inflation swap model based on perceived rate of inflation for the Eurozone, US and the UK
Sources: Refinitiv, Allianz Research
Figure 9 – Wavelet coherence of headline inflation and inflation expectations in the Eurozone, US and the UK
Sources: Refinitiv, Allianz Research
Figure 10 –Elasticity of “inflation linkers” to perceived rate of inflation (by maturity)
Sources: Refinitiv, Allianz Research
Note: “inflation linkers” = inflation swaps and inflation-indexed bonds
Figure 11 – Recursive estimate of elasticity of “inflation linkers” to perceived rate of inflation (5-year maturity)
Sources: Refinitiv, Allianz Research
Note: “inflation linkers”= inflation swaps and inflation-indexed bonds.
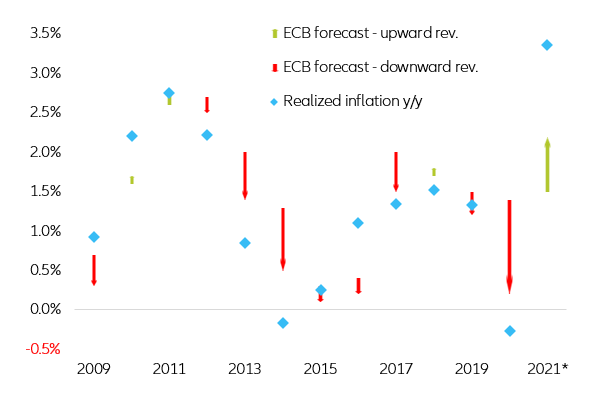
For central banks, “looking through” current price pressures remains broadly appropriate for now; however, longer-term market measures suggest a rising risk of de-anchoring inflation expectations if the energy crisis drags on. Current market-implied inflation expectations seem consistent with a fundamentals-based view of transient price pressures. We continue to expect the current inflation momentum to weaken in the second half of 2022 as base effects of energy prices dissipate and transitory price pressures due to the re-opening dynamics gradually subside. However, there is also still considerable uncertainty over how long the current price pressures will ultimately last, resulting in significant upside inflation risk, especially if a data-driven monetary policy response turns out to be sluggish. Tightening monetary policy to deal with supply side bottlenecks will contribute to lower economic activity but not deal with the underlying problem. Over the last few years, most central banks’ projected inflation has consistently been above realized inflation, which could make them more tolerant of inflation overshots (even without an average inflation trageting framework) if they remain temporary (see Figure 12). However, this also bears the risk of being “behind the curve” if structural changes in inflation dynamics would warrant earlier tightening.
Figure 12 – ECB: Annual headline inflation forecast
Sources: ECB, Refinitiv, Allianz Research
Note: The beginning and the end of the arrow indicate the ECB inflation forecast at the beginning and the end of the year, respectively.
• Headline inflation should remain elevated over the next few months. Higher energy costs will continue to push up producer and consumer prices, raising concerns about the cost of living and input prices, with adverse growth effects through their drag on household incomes and business margins. Closely watched gauges have remained largely stable, with some upward pressures of headline inflation, suggesting that price pressures are likely to be broadly transitory as a one-time surge in spending fades and supply-side constraints unwind. The pass-through of higher energy cost from wholesale to retail energy prices tends to be limited, and some governments have adopted mitigating measures. However, prices could rise significantly faster and become persistent on continued supply chain disruptions and large commodity price swings.
• Risks of large second-round effects from elevated headline inflation appear limited but the long-term market-implied inflation expectations (as opposed to professional forecasts) seem to have become gradually more backward-looking. Thus, the current low elasticity of long-term inflation expectations may not last. If continued government stimulus removes enough economic slack (and delays a normalization of labor markets), or companies manage to protect their margins by raising their own prices to compensate for rising input costs, higher expectations of inflation could, through price- and wage-setting, become a self-fulfilling prophecy and set off an inflationary chain reaction. Scaling down unconventional monetary policy measures and adjusting interest rates earlier would be necessary if evidence of inflation durably overshooting the price target materializes and before inflation expectations risk becoming unanchored.
Author

Global Head of Macroeconomics and Capital Markets Research

Head of Capital Markets Research

Senior Economist

Capital Markets Analyst