With the Covid-19 crisis, zero interest rates will become entrenched in Europe for the time being. Besides the (negative) long-term effects – rising inequality, distorted financial markets and misallocation of resources – there are also direct income effects. So far, they have resulted in the “transfer” of billions of euros from private households to the state and corporate sector. The intermediating banks, too, have suffered in the process, big time. The income effect is visible in the net interest income of sectors, which is the difference between interest income (e.g. households’ received interest from bank deposits and bonds) and interest expenses (e.g. households’ paid interest on loans) . When calculating the net interest income for the four main economic sectors – the government, households, non-financial companies and financial corporations (banks) – we use interest payments before financial intermediation services, indirectly measured (FISIM, see box below). The results for each sector in individual Eurozone countries can be replicated with the “Allianz Net Interest Income Calculator”. In the following, we discuss the results for each sector at the Eurozone level.

What is FISIM
? The national accounts refer to two forms of interest income and expense: before and after "FISIM", which stands for "Financial Intermediation Services, Indirectly Measured". This is calculated by adding/deducting the indirect fees charged by banks as part of their lending and deposit business, calculated using models, to/from the interest payments actually made. In other words, the national accounts assume that interest payments consist of two components: the "pure" interest and the price for the banking service (e.g. loan processing, deposit management).
For the purposes of our analysis, measuring the impact of low interest rates on household finances, interest income and expenses after the allocation of financial intermediation services (indirectly measured) does not seem to be appropriate. While this sort of breakdown might be consistent with the logic behind the national accounts, in the sense that it facilitates an estimate of the contribution to added value made by the banking sector, it does not reflect the reality of life for savers in any way. After all, savers do not live in a theoretical world; they are not interested in what could have been credited to their accounts at the end of the year if the indirect banking services had been taken into account. Rather, they are only interested in the funds that actually end up in their accounts. The same applies to their interest expenses, which no saver is likely to break down into pure interest payments and fees in his head. What is relevant is the amount that has to be paid to the bank every month.

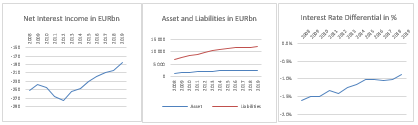
The government sector is one of the winners of the zero interest rate policy. Despite rising debt levels, the net interest income improved significantly: If annual changes over 2008 were accumulated, total savings amount to EUR195bn (2% of 2019 GDP). Given the balance sheet of governments – containing only a few interest-bearing assets but almost five times as much in liabilities – it is no surprise that its net interest income remains deeply in the red. But the improvement is nonetheless remarkable. Compared with 2008, net payments by governments (i.e. negative net interest income) have been falling by EUR70bn in the Eurozone; the turnaround since 2012, the peak of the euro crisis, is even more pronounced: it amounts to EUR90bn (see Figure 1). The decisive moment for government finances was not the beginning of the monetary easing during the Great Financial Crisis (GFC) in 2008 but the “whatever it takes” speech in 2012 by Mario Draghi, the president of the European Central Bank (ECB) at that time, which ended the euro crisis and stopped the increase in interest payments of the crisis years before.

There is no doubt about the drivers behind this development. As liabilities almost doubled over the last decade the net interest income of governments was set to deteriorate, if falling interest rates had not prevented it. In fact, the fall in rates was tilted in favor of the government, as can be seen by the improving rate differential (difference between interest rates for perceived and paid interest): While the rate for perceived interest dropped by 165 basis points (bp), the rate for paid interest fell by 240bp since 2008.

Figure 1 – Net interest income and its drivers: governments, 2008 – 2019, Eurozone

 Figure 1 – Net interest income and its drivers: governments, 2008 – 2019, Eurozone
Sources: Eurostat, Allianz Research.
The other big winner of ultra-loose monetary policy is the corporate sector. Since 2008, its annual interest bill dropped by more than EUR100bn. Cumulated annual changes amount to a whopping EUR1,070bn (10% of 2019 GDP). Similar to the situation of governments, financial companies hold more liabilities than assets, although the liability-asset ratio is not as extreme: It stood at 1.5 in 2019, down from 1.8 in 2008, i.e. over the last ten years, assets grew slightly faster than liabilities. As can be seen in Figure 2, the corporate sector benefited mostly in the direct aftermath of the GFC when interest rates on corporate debt plummeted by 120bp in 2009 alone. This is a striking difference to sovereign debt, where rates generally declined more gently, reflecting the fact that long fixed-interest periods are hardly widespread in the lending business with companies, and hence that interest rate cuts can be passed on so quickly. Ever since then, interest payments continued to fall, albeit more slowly.

There are two drivers for this development: the fall in interest rates, which was more pronounced on the liability than the asset side – 305bp vs 260bp – resulting in an improved interest rate differential (see Figure 2), and the relative debt constraint by companies: liabilities increased by “only” 3.2% per year since 2008, compared to 6.7% p.a. in the build-up to the GFC. With that, they also trailed behind assets, which clocked an annual growth rate of 4.6% over the last ten years.

Figure 2 - Net interest income and its drivers: non-financial companies, 2008 – 2019, Eurozone
 Figure 2 - Net interest income and its drivers: non-financial companies, 2008 – 2019, Eurozone
Sources: Eurostat, Allianz Research.
Not surprisingly, private households find themselves on the losing side of zero interest rates: They are an asset-rich sector but returns on their holdings have dropped close to zero (0.6%) while they still have to cope with an interest rate on their liabilities four times as high (2.5%). As a result, households’ net interest income plunged by EUR55bn (2019 over 2008) and cumulated changes amount to EUR 390bn (4% of 2019 GDP). Private households hold one third more assets than liabilities. Nonetheless, they used to have a negative net interest income as interest rates on liabilities are usually much higher than those on assets. Over the last decade, this asset overhang has increased as assets grew at 2.0% p.a., slightly faster than liabilities (1.6% p.a.). Piling into assets while yields are falling like a stone can be seen as an attempt to stabilize interest income by countering plunging rates by bigger volumes. It was a race households were doomed to lose. To stabilize interest income at the 2008 level with current interest rates, they would need four times as much assets as they own today; over the last ten years, they would have had to increase their assets by 17% per year: hardly possible. Thus, in reality, interest income fell by 78% since 2008 to a mere EUR53bn in 2019; in contrast, interest payments declined by 44% to EUR171bn. As a result, net interest income sank deeper into the red (see Figure 3).

Contrary to the development in the two other sectors, the interest rate differential hardly improved for households: it still stands at around 200bp as both rates on received and paid interest dropped more or less in sync since 2008 (274bp vs 282bp). There were, however, two episodes where this differential moved in favor of households: The first episode was the build-up to the euro crisis when some (stressed) banks tried to attract funds with higher deposit rates while rates on loans continued to slide. The second episode relates to recent years as interest rates on assets have not much room left to fall, while interest rates on liabilities continue to decline as old mortgage loans with high rates and long fixed-interest periods are increasingly replaced by new ones with lower rates (Figure 3). As this refinancing should go on in coming years, the rate differential is set to further improve – and the net interest income might stabilize or even increase in the process. Even if the zero interest rate policy continues there is some light at the end of the tunnel for private households.

Figure 3 - Net interest income and its drivers: private households, 2008 – 2019, Eurozone
Sources: Eurostat, Allianz Research.
Financial companies, mainly banks, are the only sector with a positive net interest income as they boast both an asset-overhang and a positive interest rate differential. The deterioration of the latter, however, caused the net interest income to decline by EUR120bn to EUR450bn in 2019. Cumulated changes amount to EUR865bn (8% of 2019 GDP). Over the last decade, financial companies’ assets outgrew liabilities, albeit by a relative small margin (2.8% p.a. vs. 2.2% p.a.). This in itself should have led to a rising net interest income. At the same time, however, the interest rate differential fell significantly as rates on received interest dropped by 294bp while rates on paid interest by “only” 270bp. The former might be attributable to the fact that banks piled into low-yielding assets such as sovereign bonds in recent years; the latter reflect the fact that banks usually enjoy the lowest rates of all sectors on their liabilities – the chunk of them being bank deposits – limiting the extent to which they can fall. Although both received and paid interest declined as a result, the gap between them – the net interest income – became narrower in absolute terms (see Figure 4).

This development clearly stigmatizes banks as one of the losers from the zero interest policy. This conclusion, however, has to be taken with a pinch of salt. Banks were the big winners of the boom that led to the GFC; with EUR573bn, the net interest income of Eurozone banks reached an all-time high in 2008. The decline thereafter can partially be seen as a sort of normalization as the conditions at that time were unsustainable in any case.

Figure 4 - Net interest income and its drivers: financial companies, 2008 – 2019, Eurozone
Figure 3 - Net interest income and its drivers: private households, 2008 – 2019, Eurozone
Sources: Eurostat, Allianz Research.
Arne Holzhausen
Head of Insurance, Wealth and Trend Research
Janine Junge
Research Assistant