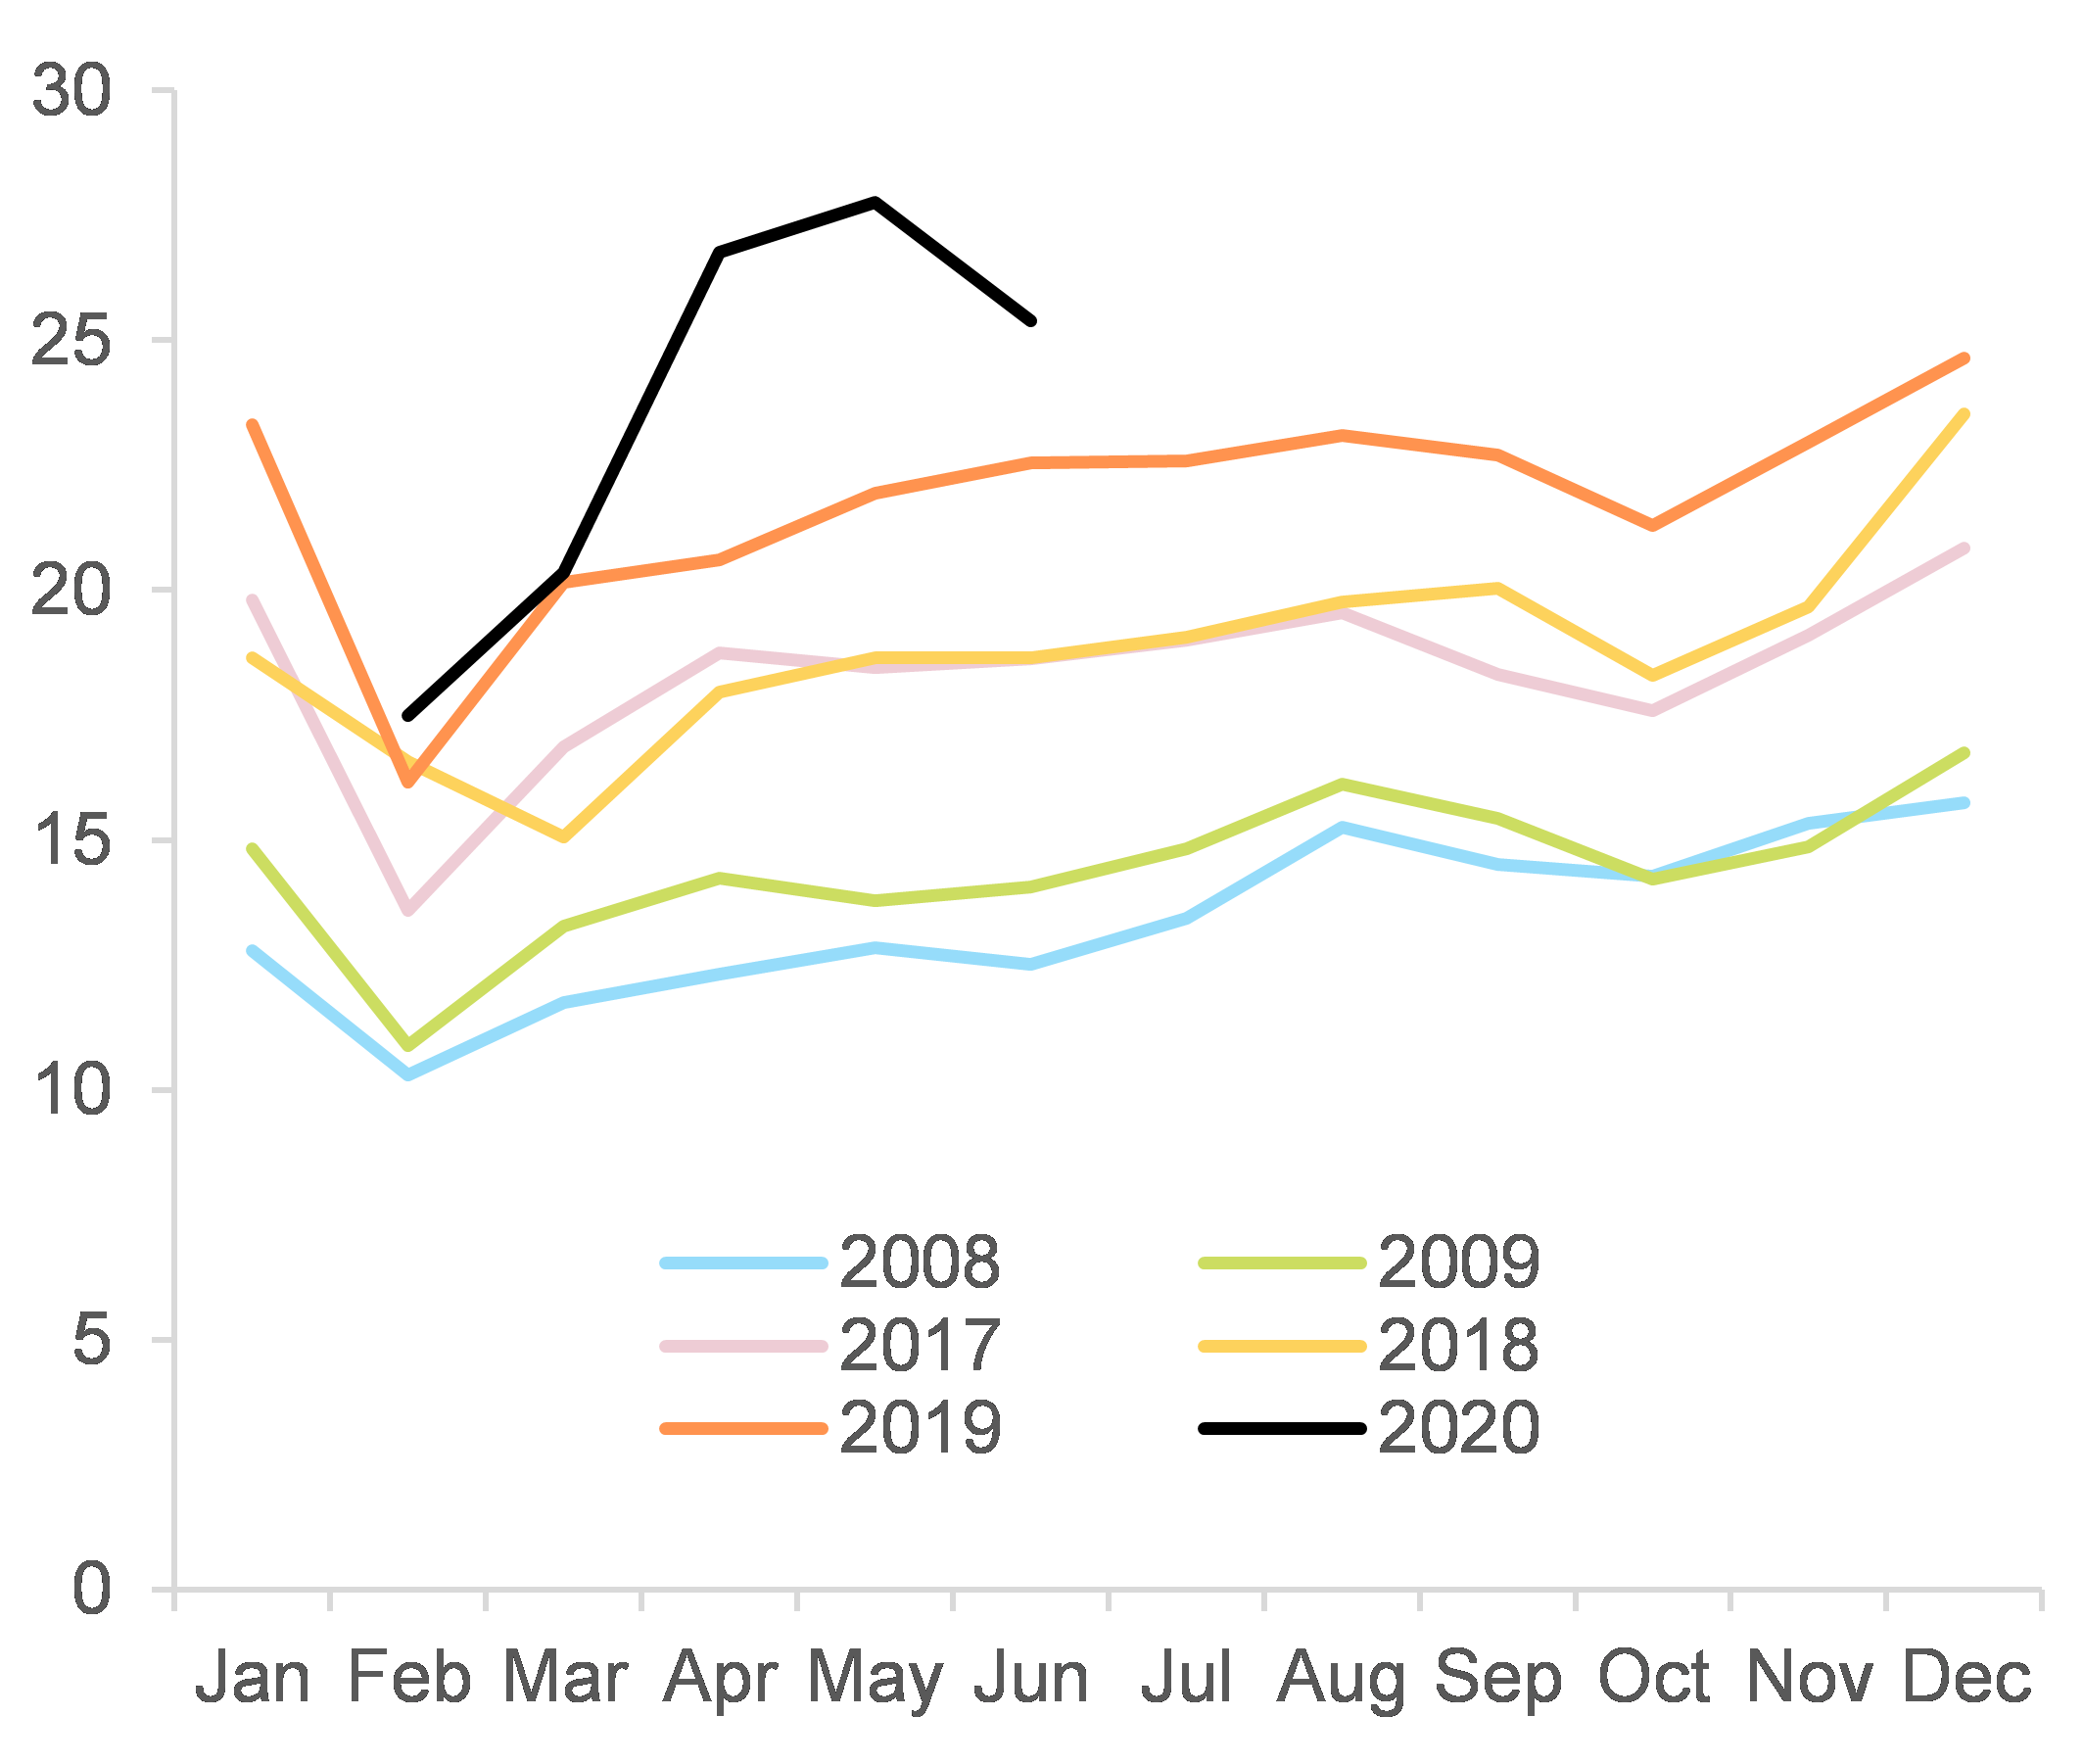
China’s exporters have been gaining market share since they exited the Covid-19 crisis. Out of the top 20 exporters in the world, China’s total market share now stands at c.25%, compared to an average of c.20% over 2017-19 (see Figure 1). Such a rapid increase had not been seen in previous global crises. Chinese exports have surprisingly outperformed this year, leading to the trade balance clearly contributing positively to GDP growth (admittedly also supported by lower imports). In Q3 2020, GDP grew by +4.9% y/y, with net exports contributing by +0.6pp (compared with +0.3pp on average over 2017-19).
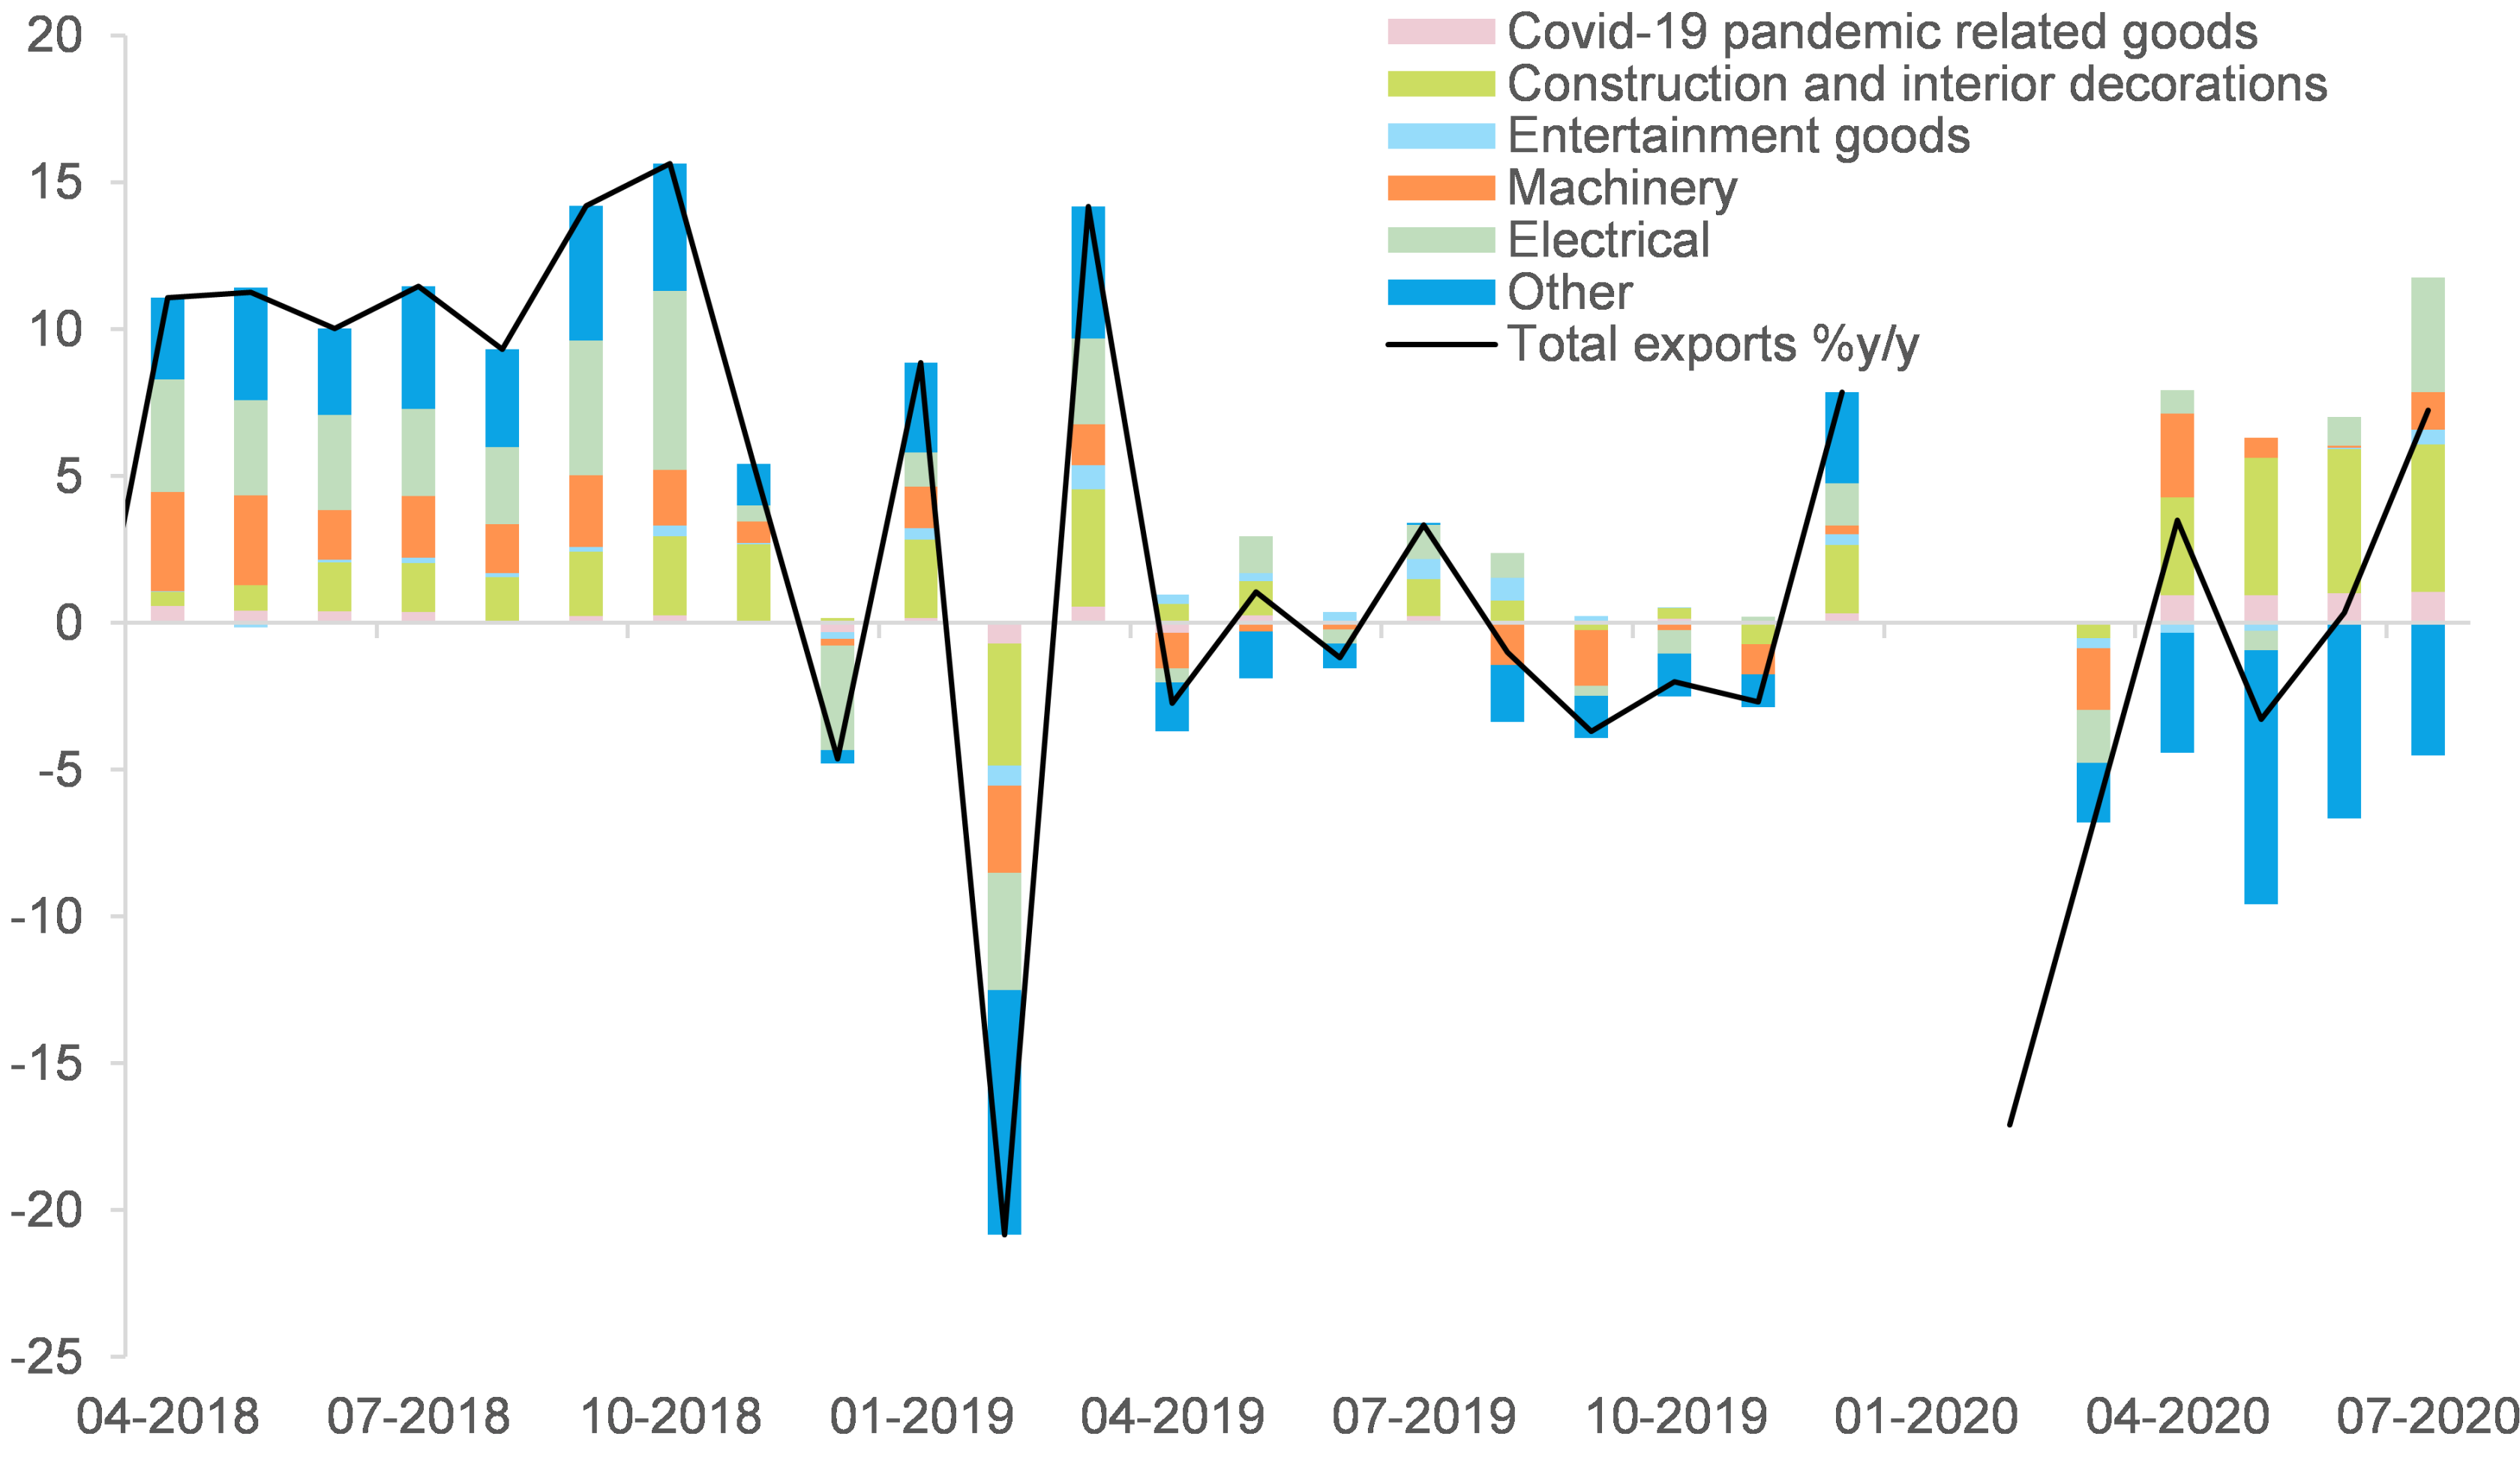
Part of this market share gain is driven by the Covid-19 pandemic, as it increases global demand for medical goods and electronics. Breaking down detailed sectoral trade data, we find that Chinese exports of pharmaceutical products (e.g. paracetamol, masks), washing preparations (e.g. hand sanitizers, soap), special yarns (e.g. raw materials for masks and coveralls), headgear (e.g. medical headwear) and medical instruments (e.g. ventilators, thermometers) – which we group under the label Covid-19 pandemic related goods in Figure 2 – have risen rapidly. Contribution to overall exports growth averaged +1.0pp since June 2020, compared with just +0.2pp on average over 2017-19. China’s export market share for these goods surged to 11.5% on average this year, compared with 8.8% on average over 2017-19 (see Figure 3). Similarly, global demand for some machinery and electrical goods (e.g. computers, monitors, mobile phones, headphones, integrated circuits, etc.) surged in the context of the Covid-19 crisis and the shift towards more remote working. China’s export market share for machinery and electrical goods stands at 33.0% on average this year, compared with 27.1% on average over 2017-19 (see Figure 4).
China’s exports outperformance is also supported by goods related to construction and interior decorations . Solid demand for these goods is likely supported by strong monetary and fiscal easing across the world. Exports of these goods from China contributed significantly positively to the country’s overall exports growth, by +5.0pp on average since June 2020, compared with +1.1pp on average over 2017-19 (see Figure 2). In terms of global market share, China’s exporters increased their reach to 33.8% on average in 2020, compared with 23.4% on average over 2017-19 (see Figure 5).
External demand for other goods, e.g. related to textile, leather, garments, transport, or some metals and mineral oils, are still in a slump. Exports of these goods from China contributed negatively to overall exports growth, on average by -5.6pp since June 2020, compared with +1.5pp on average over 2017-19 (see Figure 2). That being said, China is not losing market share there either, with the average in 2020 at 18.4%, compared with 15.0% over 2017-19 (see Figure 6).
In terms of countries, Chinese exporters’ penetration increased in almost all of their major destination countries (notably in Europe and Asia) – with the U.S. being a notable exception (see Figure 7). Indeed, the share of U.S. imports coming from China declined to 17.8% on average this year, compared with 20.6% on average over 2017-19. Conversely, Chinese exporters’ market share clearly increased in Europe and Asia. More precisely, we estimate that the share of total imports coming from China in the top 5 Eurozone countries reached 11.5% on average this year, compared with 9.0% on average over 2017-19. In South Korea and Japan, the shares rose respectively from 20.6% to 22.6% and from 23.7% to 24.8%. Apart from China, export market share of other economies with good management and control of the Covid-19 epidemic have also been rising this year (e.g. Vietnam, Taiwan, South Korea). These market share increases seem to be happening to the detriment of European exporters.
We expect Chinese exports to remain resilient in the coming quarters, in the context of renewed waves of Covid-19 infections and in an environment of low interest rates. Demand for Covid-19 pandemic related goods should subsist in the short-term (or as long as the virus is still circulating). While exports of these goods are poised to decline eventually, sectors hurt by the epidemic (other goods in our categories) are slowly bottoming out. The slump in Chinese exports in these sectors subsided from -26.2% y/y in May to -13.4% in July. Finally, Chinese exports are likely to remain supported by strong demand for goods related to construction and interior decorations. Indeed, housing construction and infrastructure projects will be driven up by the environment of low interest rates and persisting accommodative monetary policies, while positive effects from fiscal stimulus packages will materialize further in 2021 (see our latest global economic outlook update here). This rather sanguine outlook for Chinese exports means that the county’s current account balance is likely to remain in positive territory in the coming year – we expect +1.3% of GDP in 2020 (after +1.0% in 2019) followed by +0.7% in 2021.
Downside risks against Chinese exports remain, with the strong currency potentially becoming a drag on exporters’ competitiveness. First, the risk of prolonged Covid-19 outbreaks globally (and the risk of renewed outbreaks in China) could trigger a significant economic slowdown in Q4 2020 and Q1 2021. Second, straining relationship with trading partners, particularly the U.S., remains a risk regardless of the outcome of the U.S. presidential election. Finally, Chinese exporters are at risk of losing competitiveness due to the stronger currency. This risk may however be less relevant currently than during usual times, given lower elasticity of demand to prices for Covid-19 pandemic related goods. Furthermore, we think that the recent appreciation of the Chinese currency could be running out of steam, and expect the USDCNY onshore rate at 6.6 at 2020-end, implying 1.5% additional appreciation (after already 4.0% since August 2020).
Figure 1 – China’s overall exports market share (%, out of top 20 exporters)