The untold story of Davos: The paradox of Inclusive Inequality

The untold story of Davos: The paradox of Inclusive Inequality

January 23 2019
  • When assessing wealth inequality and their dynamic in a globalized world, it is vital to differentiate inequalities among countries and inequalities within countries.
  • The now popular narrative of ever-widening inequality is indeed only telling half of the story. It neglects the huge strides made towards better participation from a global perspective as well as the improvements within many developing countries. 1.1 billion people form the global wealth middle class today, and global concentration of wealth fell below 80%.
  • There is no denying that wealth is still unevenly distributed at a global level – and increasingly so in some industrialized countries, first and foremost the US. This situation creates a so-called inclusive inequality paradox. More people are participating in average wealth, while at the same time, the tip of the wealth pyramid is moving further and further away from this average, and is getting smaller and smaller.


Globalization: A blessing for wealth inequality among countries

In order to analyze how wealth is distributed at global level, we have divided all individuals into global wealth classes. This classification is based on worldwide average net financial assets per capita, which stood at EUR 25,320 in 2017, more than twice as high as in 2000. The global wealth middle class ("middle wealth", MW) includes all individuals with assets of between 30% and 180% of the global average. This means that for 2017, asset thresholds for the global wealth middle class are EUR 7,600 and EUR 45,600. The "low wealth" (LW) category, on the other hand, includes those individuals with net financial assets that are below a EUR 7,600 threshold, while the term "high wealth" (HW) applies to those with net financial assets of more than EUR 45,600.

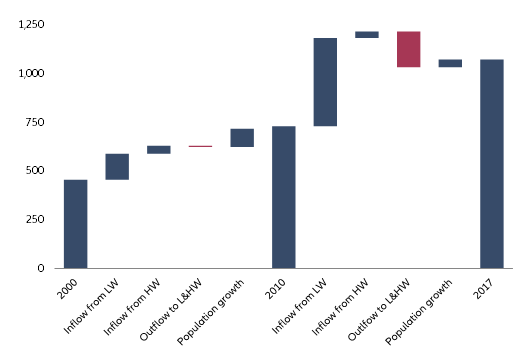
The last two decades of rapid globalization have given rise to a new global wealth middle class, which includes almost 1.1 billion people in the countries we have analyzed. Fewer than half a billion people belonged to this group at the turn of the millennium, with just under half of them coming from Western Europe, North America or Japan. Today, these countries account for only a quarter of the global wealth middle class. In contrast, China's share has soared from just under 30% to over 50% in this period. There is therefore little doubt about what the driving force behind the new global middle class is: its emergence primarily reflects the rise of China.

The figures accompanying this success story are impressive. Around 500 million Chinese people have moved up to join the ranks of the global wealth middle class since 2000, and over 100 million more can now even consider themselves part of the global wealth upper class. That means that China accounts for about 80% of movements between wealth classes since the turn of the millennium. China's rise gained further momentum after 2010, in the post-financial crisis era, which was due not least to the fact that asset growth elsewhere was somewhat weak during this period. This ultimately caused the wealth middle class in the "old" industrialized countries to grow as well, although here the trend was the other way around: about 60 million people joining the middle class have moved down the scale, i.e. as households that have been "relegated" from the high wealth class. This affects primarily the US and Japan, but also European countries such as Italy, France and Greece.

Figure 1: Change in global wealth middle class, in million

Figure 1: Change in global wealth middle class, in million

Source: Allianz Global Wealth Report 2018

Compared with the rapid growth in the wealth middle class, changes in the other two wealth classes appear fairly modest. The wealth upper class grew by almost +30% to around 560 million people, mainly owing to the "revitalization" of China, which more than offset the "bloodletting" in the old industrialized countries. This also means that the upper class overall is much more heterogeneous than previously, when it was made up almost exclusively of western Europeans, Americans and Japanese. This group accounted for well over 90% of the wealth upper class at the beginning of the millennium, compared with only two-thirds today.

The global wealth lower class, on the other hand, has actually contracted from 3.5 billion people in 2000 to 3.44 billion at the end of 2017. This figure does not appear particularly impressive at first glance. Without movements between classes, however, the wealth lower class would include an extra 510 million people compared with 2000, owing to population growth alone. That means that nearly 600 million people have actually moved up from the wealth lower class. This also becomes clear if we look at the number of people belonging to the wealth lower class in relation to the population as a whole: their share has dropped from 80% (2000) to 68% (2017).

Development of global wealth distribution therefore underlines the positive effects of globalization once again. This mass advancement up to the global wealth middle class is a success story. By global standards, more and more people are able to share in worldwide prosperity.

Yet this development is by no means complete, firstly because it is mainly only a handful of Asian countries, and above all China, that have benefited from it to date. If other heavily populated countries such as Brazil, Russia, Indonesia and in particular India were to exploit their potential in a similar way over the coming decades, the global wealth middle class could easily double again by 2030. Secondly, the emergence of a new global wealth middle class cannot disguise the fact that the concentration of wealth is still extremely high from a global perspective. This becomes clear if we break down the overall population of the countries we have analyzed into population deciles based on net financial assets.

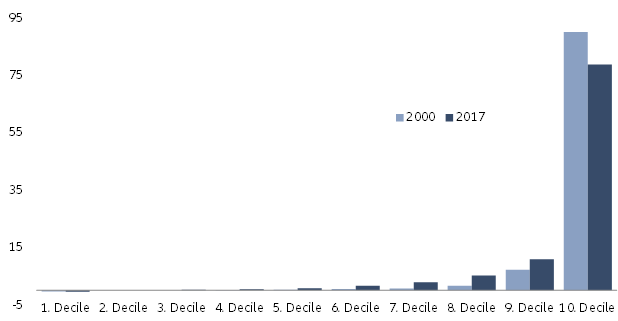
This shows that the richest 10% worldwide together own 78.9% of total net financial assets, while less than 1% is left for the lower half of the population, about 2.5 billion people. The latter figure must be interpreted with caution, however, as those with the fewest assets also include many people from the richest countries who are in debt; the "poorest" global population decile actually has negative net financial assets, but high levels of debt cannot necessarily be equated with poverty.

Figure 3: Share of global wealth deciles in total net financial assets, in %

Source: Allianz Global Wealth Report 2018.

The Scandinavian countries are a good example of this. Households in Denmark and Sweden are among the most highly indebted worldwide, with up to 30% of the population there having higher liabilities than financial assets. However, these high debts are generally likely to be offset by tangible assets, particularly property. A happy home owner in Denmark should not be confused with a penniless day laborer in India.

The trend is also moving in the right direction with regard to the strong global concentration of wealth. In 2000, the concentration of wealth (the share of the richest decile of the population in total assets) was 90.3%. Moreover, apart from the richest and the poorest decile, where debt continued to rise, all other population deciles increased their share of the global wealth pie. The shares of the sixth, seventh and eighth deciles – the upper middle class – grew particularly strongly, with the figures more than tripling. From this perspective, it therefore also appears that the world as a whole is in the process of becoming a better world where distribution is fairer – even if there is still undoubtedly a very long way to go. And furthermore, it seems as if the ultra-rich, the richest percentile of the population, are not affected: their share in total assets remained surprisingly stable at around 40%.

Another parameter that can be used to measure the distribution of wealth is the median figure and/or a comparison between the median and the average. The further away the latter is from the median, the greater the inequality in distribution. Once again, a look at the global figures is sobering. Median net per capita financial assets of EUR 2,810 stand in contrast to an average figure of EUR 25,320. As with the concentration of wealth, however, what is crucial when it comes to median assets is their development – and that is unequivocally positive. As recently as 2000, the median figure for net financial assets was EUR 340. Median assets have grown at an average rate of 13.3% per year since then, considerably faster than average assets (+5.1%).

A curse for wealth inequality within industrialized countries?

Although this division into global wealth classes is very useful when it comes to analyzing how global weightings are shifting, it is likely to remain rather abstract for most of the people concerned. This is because the benchmark for most households is not the global average, but rather their national average – people are interested first and foremost in how much their neighbor has.

However, the relationship between median and average assets is also a good measure of the distribution of wealth in a national context. Even a direct comparison between median and average net per capita financial assets is very revealing. If we drew up our rankings of the world's richest countries based on median values, they would look different. Three countries would drop out of the Top 10 completely: the US (from second to 14th place), Sweden (from third to 12th place) and Denmark (from ninth to 23rd place). Other countries that would slide down the rankings are Chile and South Africa (each -7 places), Latvia and the UK (each -4 places) and Malaysia and Germany (each -3 places) – the latter would thus also drop out of the Top 20. Median assets are significantly lower than average assets in all of these countries in an international comparison, an indication of relatively unequal distribution of wealth. At the same time, however, there would be many countries that would move up the rankings, particularly Italy and Slovakia (each +6 places), Australia (+5 places) and Canada, Ireland and Romania (each +4 places). The difference between the two measurements of assets is fairly small in these countries, showing that wealth distribution is more equal. However, this list of countries that would move up or down the scale also makes it clear that it is difficult or even impossible to recognize a pattern in wealth distribution, either geographically or in terms of level of development.

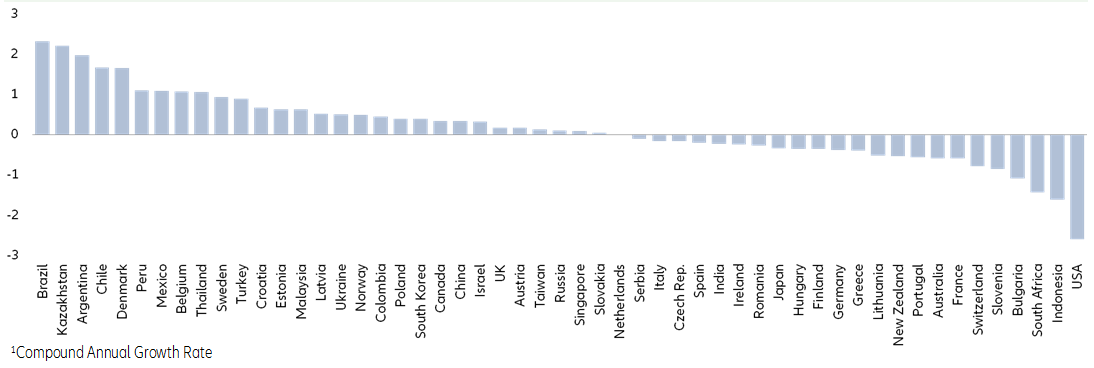
Figure 5: Growth difference between average and median net financial assets, in percentage points, CAGR1 2000 to 2017

Figure 5: Growth difference between average and median net financial assets, in percentage points, CAGR1 2000 to 2017

Source: Allianz Global Wealth Report 2018.

The alternative rankings naturally only provide a snapshot of the current situation. The long-term development of wealth distribution is certainly more interesting. To work this out, we have compared annual growth rates (2000-2017) in median and average net financial assets. Where have median assets grown faster, indicating an increase in prosperity, particularly in the middle of society? And where have average assets risen faster, a sign that the richest members of society are moving further and further away from the middle? Just as in the comparison of current figures, long-term development also shows a very heterogeneous picture.

What is immediately striking is that of the countries we analyzed, there are more countries (30 in total) in which distribution, based on development of median assets, has improved since the turn of the millennium. It is also clear that the top places are dominated by Latin American countries. Although assets are still very unequally distributed in many of these countries, improvements in the last two decades have been striking. Many eastern European and Asian countries also have a positive growth differential between median and average assets. In contrast, few western European countries appear here; Denmark, Belgium and Sweden are the only places where wealth distribution seems to have become more balanced since the turn of the millennium.

At the other end of the spectrum are the "usual suspects", particularly the US. Nowhere else has development of median and average assets diverged more sharply, and nowhere else is the absolute gap between these two figures wider. While the average net financial assets of a US citizen total EUR 168,640, the median figure is only EUR 24,690. Once again, these figures confirm the reputation of the US as one of the world's "most unequal" countries.

Indonesia and South Africa, another two countries with a reputation for distorted wealth distribution, also have a very high negative growth differential. Furthermore, a comparison of growth shows that wealth distribution has tended to worsen in many European countries over the last few decades, albeit to a lesser extent than in the US. These include the euro crisis countries (Portugal, Greece, Ireland, Italy and Spain), but also Switzerland, France and Germany. The list is rounded off by countries such as Australia and Japan. The perception that the "old" industrialized nations in particular have been suffering in recent decades from a growing gulf between rich and poor therefore corresponds to reality in many cases. It's therefore not surprising that globalization is viewed much more critically in these countries than in emerging economies, which have benefited on the whole from the increasing international division of labor, including with regard to the distribution of wealth within countries.