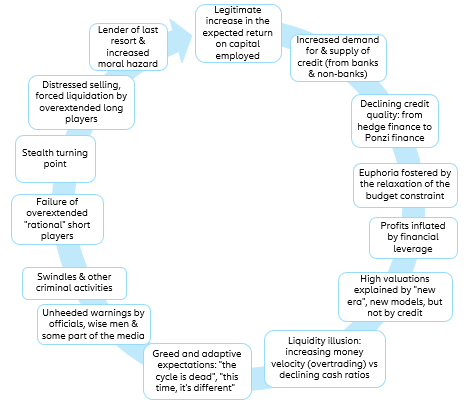
The recent US equity market rally, which saw some stock prices multiplied by 10x to 15x within a week, highlights the rise of a new kind of “all-in” retail investor, one that is ramping up leveraged trading through the derivatives market, primarily via call options. This unexpected market behavior has sparked claims of a structural change in the functioning of capital markets. However, this situation is not really new: Despite having to concede that the tools, outreach and amplification of the equity rally have structurally changed by the extensive use of social networks and other online platforms, most of the recent equity rally’s characteristics are common in a “late” equity cycle stage. These include a reliance on leveraged investing to quickly multiply gains, signs of market manipulation/fraud starting to appear and, lastly, the Fear of Missing Out (FOMO) effect leading to overtrading. All those signs, and more, can easily be found in a traditional Fisher-Minsky-Kindleberger clock (see Figure 1).
Figure 1 – The Fisher-Minsky-Kindleberger model
Sources: Adapted from Charles Kindleberger’s Manias, Panics and Crashes a history of financial crises, 1978
But, why did retailers enter the stage now, in one of the biggest economic crises? Four conditions were decisive for this development:
- Widespread and easy access to options trading, offered by trading apps since 2018.
- The surge in social media usage and proliferation of social media influencers as opinion leaders, creating an informal and ‘new’ way of mobilizing capital (e.g. targeting heavily shorted stocks).
- A significant reduction in transaction costs for derivatives and trades in the small-cap market segment, where they could easily become prohibitive: Transaction fees were cut to almost zero by some trading apps in early 2020 (although retailers are paying a wider bid-ask spread).
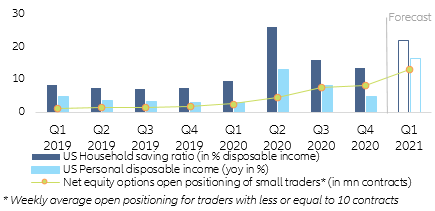
- The availability of liquidity with low opportunity costs: The first lockdown sparked an explosion in the saving ratio (in Q2 2020 26% of disposable income, disposable income increased by 13% y/y) amid falling interest on bank accounts and limited spending possibilities (see Figure 2).
Figure 2 – Saving ratio, disposable income and retail options trading
Sources: Refinitiv, OCC, Allianz Research
However, targeting the most shorted stocks through the options market is not typically endogenous to retail investors, requiring a certain degree of financial sophistication. This hints that there are some seasoned professionals trading in this market, perhaps professionals using personal accounts. Indeed, in the recent rally, the market impact was magnified by the accelerated Delta and Gamma options hedging strategies used, a trading trick that hedge funds and large investment institutions have also been using for some time . But we observe a new type of “all-in” retail investor is emerging, one who buys up to his margin limit (i.e. borrows against this wealth to buy more shares) and is thus very different from the traditional type focused on long-term valuation-based investments.
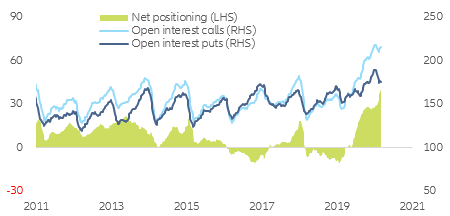
This trend can be traced in options trading data . Weekly transactions of call options (flow) have tripled since the beginning of March 2020, while put options transactions (flow) have remained close to previous levels – puts have experienced an increase since the beginning of this year, as fears about a market downturn start to get some traction. In terms of net open interest (stock), this has been the longest structural rally in US history. Although there had been higher peaks before, they were extremely short-lived. In terms of “end of week” figures, since early July 2020, the net open interest has been above 20mn contracts in all but four weeks; since early December 2020, it has been above 30mn contracts in all but two weeks; in February 2021, all weeks were above 40mn. It is noteworthy that, despite experiencing extreme long call positioning, markets could likewise experience extreme put positions that lead to an exacerbated correction should investor sentiment quickly change.
Figure 3 – Total US options open interest (EQ + Index + ETF) (mn contracts). Moving average comprising 8 weeks.
Sources: OCC, Allianz Research
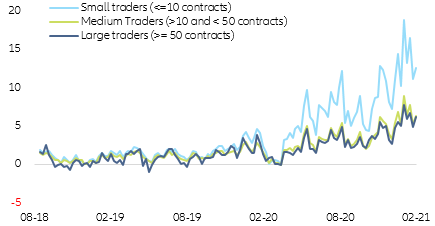
Digging into the surge in option trading, one can observe that small traders – those with transaction sizes of less than 10 contracts - have structurally accelerated their transaction volumes, with the flow of net weekly options purchased (new calls – new puts) being multiplied by ~10x since the beginning of 2020. In comparison, medium and large traders have seen these same volumes increased by ~5x to ~6x (see Figure 4).
Figure 4 – Difference between new calls and new puts purchased weekly. (mn contracts)
Source: OCC, Allianz Research; Net weekly purchases = New Calls – New Puts.
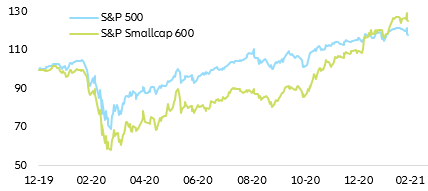
Extreme positioning in certain stocks has led many small retailers to lose lots of money. Since the beginning of the market rally, retail and speculative investors have kept bouncing between different single stocks and sectors, from electric vehicles to technology, gaming, silver, VIX and others. But they have primarily targeted small, micro and penny stocks with an investment motto of “the lower the price, the cheaper and the higher the upside potential”. This can be seen in the recent outperformance of small cap indices vis-a-vis large caps (see Figure 5). In the recent rally, Gamestop, AMC, Express and Dogecoin, among others, were the ones that made it to the front page of major newspapers, as those specific stocks generated triple-digit returns within a two-week timespan.
Figure 5 – US Large vs Small caps (100 = Dec 2020)
Source: Refinitiv, Allianz Research
We believe it is by no means a coincidence that these extreme market movements are taking place in this specific market segment as it is in the nature of delta/gamma squeezing strategies. To be successful, they need to trigger an unstable equilibrium share price by a demand shock in order to clear the market at a new higher equilibrium. This requires two things: (i) sufficient wealth and (ii) access to leverage of at least 2:1. For retail investors, the targeted companies need to be small enough for their wealth to matter but large enough to have traded options. Of course, meme stocks seem to be ticking all the boxes for these events to take place.
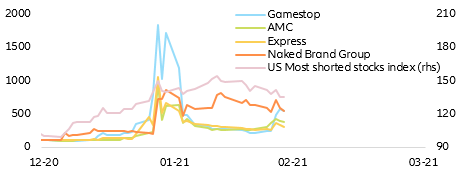
This stock-picking preference also explains the preference for “distressed” or “struggling” companies as a minor movement triggers a massive, almost discrete rally. However, as tends to happen when things go up fast, they also go down extremely fast (see Figure 6).
Figure 6 – US most shorted stocks & single names (100 = Dec 2020)
Sources: Refinitiv, Allianz Research
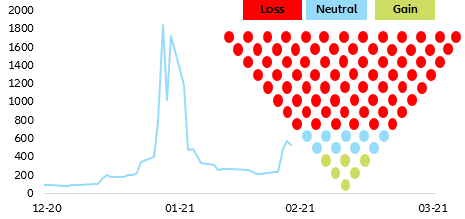
Extreme market rallies tend to happen in a staggered manner and this one was no different: Initially some early bidders enter into the stock, generating minor initial readjustments of future return expectations and making the stock appear in the daily equity leaderboard. These early-bidders are normally followed by big investors that recognize the upside trend and invest accordingly (these big investors do not publicly disclose their positioning in the stock). The melting pot of investors constitute the base of an inverted pyramid. Next, the rapid price appreciation triggers a “call” or “FOMO (Fear Of Missing Out)” effect that leads many small investors to participate in the “expected” disproportionate upside potential. However, this call effect is well known as the rational inattention theory suggests that such a 5-sigma event paired with some market influencer suggestions may prove enough to trigger such an extreme repositioning. However, reality tends to prove quite harsh for most small investors, as this irrational effect leads them to enter the market near its peak. Overall, this behavior creates an unwanted “Ponzi scheme” dynamic, hitting those entering last.
Following this rationale and considering a buy & hold strategy for simplification purposes, one can qualitatively depict (see Figure 7) how the early birds (green dots) will, on average, navigate through the market turbulence with a final positive return even after the market correction. The second round of joiners (blue dots), on the other hand, will end up with a mildly positive to flat return. However, inevitably, most of the small traders/retail investors (red dots) that enter late into the game will lose a great part of their initial investment. This shows the importance of adjusting one’s investment strategy based on what part of the rally a rising stock is believed to be in. Importantly, capital market influencers will never publicly disclose trades before they have been settled, so waiting for external guidance on buying and selling signals will always result in less returns and larger losses.
Figure 7 – Gamestop and the inverted pyramid (100 = 31.12.2020)
Sources: Refinitiv, Allianz Research
As in other sectors, the quality of trading tools also matters in capital markets: even a retail investor who closely follows Twitter feeds and influencers, and trades according to those “leads”, is at a structural disadvantage against high-frequency traders, hedge funds and other investors with better hardware and software. These financial institutions use artifical intelligence and natural-language processing to instantly process massive amounts of information and have the capacity to trade thousands of times with the same information before a retail investor has even opened a trading app.
Is the new wave of retail investors and rising options trading increasing financial systemic risk? One possibility is a domino effect if some market participants need to cover their long-call position-related losses. Nonetheless, there might be a bigger issue building up as the liquidity needs generated by options trading may catch the financial system naked.
Can’t we see the forest for the trees? Much has already been said about central banks’ puts and their impact (distortion) on risk-seeking behavior: by taking care of the downside risk, central banks have been incentivizing market participants to take higher risks than they otherwise would. One way of doing so is to sell volatility by selling out-of-the-money options, notably puts. That is, risks are insured via central banks, which ultimately means risks are being mutualized by society.
To a certain extent, the growth of Exchange Traded Funds (ETFs) is a tribute to central banks’ puts: were investors not so confident to be backstopped whenever needed, they would be less inclined to take pure market risk, and less inclined to prioritize beta over alpha . But ETFs also have their own impact on market behavior. By tracking stock market indices, they put stock security selection on autopilot, limit the potential for rotation and ensure that the winners remain the winners. They make the upside more likely than otherwise.
The combination of central banks’ puts with ETFs makes the buying of out-of-the money calls on stock market indices a kind of sure or one-way leveraged bet. As a result of these dynamics, we should persistently witness a rise in the volume of outstanding call options on stock market indices.
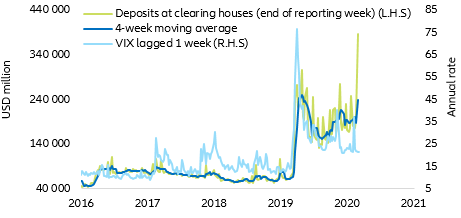
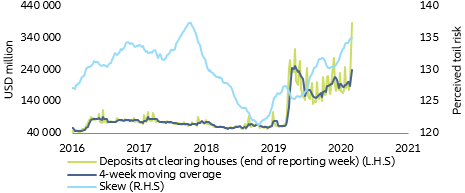
There is some evidence that this has been taking place since the middle of 2020. One can indirectly gauge the volume of outstanding options (and futures) in organized markets by looking at the deposits held at what the Federal Reserve calls “designated financial market utilities”, i.e. clearing houses. These margin deposits typically rise when implied volatility spikes, which usually happens when equity markets fall. However, since the middle of 2020, these deposits have risen from USD130bn to USD 390bn at a time when the equity market was going up and implied volatility was falling (see Figure 8). All in all, the latest increase of ~USD 190bn in one week is a humongous number, indicating that derivatives (especially call options) have become a new and important source of liquidity demand.
Figure 8 – Deposits at clearing houses and VIX
Sources: Refinitiv, Allianz Research
At their current level, deposits at designated financial market utilities are much higher than they were before 2020, or even before the volatility spikes experienced in early and late 2018 when volatility short-sellers were wrong-footed by brief but pronounced stock market declines. This suggests that options positions, predominantly call options, are now larger than they have ever been during a bull market. As shown in Figure 10, the rise in the skew indicates that out-of-the-money options are expensive relative to at-the-money options: this fits well with the market dynamics described above (see Figure 9).
Figure 9 – Deposits at clearing houses and Skew
Source: Refinitiv, Allianz Research
Skew difference in implied volatility between out-of-the money options, at-the-money options and in-the-money options.
Now, there are good reasons to believe that the options market, supposedly a ‘derivatives’ market, has become the tail that wags the dog. To hedge their positions in terms of delta and gamma, the professional sellers of call options indeed need to buy futures, the more so the more the market rises, thus ensuring a spillover from the options market to the futures market. But the domino effect does not stop in the futures market. As futures and spot prices have to be in a certain relationship – a relationship that is both monitored and enforced by arbitragers – a rise in futures prices necessarily spills over into the spot market, which validates the buying of equities. The show can go on…
Such a positive feedback loop, in which higher prices beget higher prices, seems to be unstoppable. At first glance, it warrants abiding by the first part of the well-known stock market maxim: “Let your profits run…”. But seasoned speculators also abide by its second part, which says: “… but cut your losses early”. Raising stop-loss orders as the market rises or implementing a value-at-risk approach are the typical strategies aiming at cutting losses early. But a strategy is no longer a strategy once it becomes conventional wisdom.
However, this snowball effect also happens on the downside. If buyers of call options start for any reason to unwind their positions, the sellers of call options as well as the sellers of out-of-the money puts will have to sell futures, which will trickle down to the spot market. A negative feedback loop will ensue. In other words, volatility suppression, options trading, ETF investing and options hedging should be seen as a repetitive game in which the stakes are increasing, probably exponentially, at each round.
Despite the massive increase in deposits at clearing houses, and more importantly the jump in cash needed to meet the increased capital requirements (margins) due to higher option positions, we still maintain that there is enough public and private liquidity in the market to absorb the increased trading volumes at current levels but it may prove challenging if the liquidity demand skyrockets. Nevertheless, the current assumption on financial stability is subject to two caveats. Firstly, it assumes that there will not be an extreme market correction and secondly it assumes that, at some point in the near future, accelerated options markets will stabilize.
Of course, as in any business, there are different measures that can be taken to mitigate the possible impact of an adverse market scenario to the financial system. For example, optimizing the T+2 settlement, bringing it closer to real-time settlement but preventing the closure of other parts of the financial business (e.g. securities lending, short-selling) would be a step forward in preventing market illiquidity.
Be that as it may, it is important for regulatory bodies to discuss the topic as the recent emancipation of retail traders may lead to them claiming a share of the revenues from securities lending that their brokers generate and from the gains hedge funds generate with their lent stocks, evoking to a redistribution of fees/commissions in financial transactions. If that was to happen, will the short-selling industry recover from the shock? Otherwise, do we stop the T+2 settlement where between transaction and settlement the ownership of the stock allows many exchanges? This is something for regulators to discuss but the fact that recent events triggered such a discussion should be perceived as a positive signal for the industry.
There is some jurisprudence on the topic as after the Great Financial Crisis and the short betting that took place, regulators made it mandatory to make public any short position that is above certain percentage of the issued share capital (5% in the US, 0.5% in the EU). Not surprisingly, all the initial meme stock names belonged to some of these lists and, as humans tend to learn from mistakes, these events may trigger a regulation change/enhancement. Modern trading platforms would be the main target of this potential new wave of financial markets regulation.
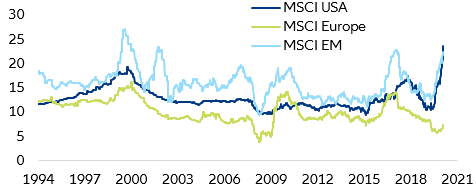
What does this mean for investors? The rally could continue, but the distribution of potential outcomes becomes increasingly skewed to the downside. Some things have remained unchanged even after the recent equity rally: fundamental valuations and market positioning remain on the extremely frothy side, meaning that it is extremely difficult, if not impossible, to find another time in capital markets history in which equity markets were so fundamentally overvalued when compared to traditional valuation techniques. This is specifically the case for both the US and Emerging Markets but not that much for European equities (Figure 10).
Figure 10 – Long-term EPS growth expectations (in %)
Source: Refinitiv, Allianz Research
The probability of a market correction far outpaces that of a continued market rally. However, this assessment assumes that fundamentals matter and that market forces tend to return fundamentally imbalanced stocks to their long-term fundamentals. In the current context of extremely accommodative monetary and fiscal policy, these historical market dynamics may remain broken for a prolonged time. Due to this situation, we expect global equity markets to have a flat to timidly positive (single digit) 2021 performance, while we do not zero out correction pockets in overstretched sectors such as technology, telecommunications and US automotive.
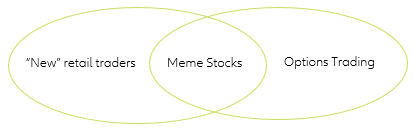
Finally, we do not expect ‘new’ retail trading on capital markets to pose an immediate risk for the normal functioning of the financial system. However, the massive increase in options trading (not only by retail investors) may definitely create some instances of temporary liquidity shortages, which should not be structural but will create some unwanted volatility and raise some questions about ‘new’ brokers’ liquidity (see Figure 11), more so as, interestingly enough, this situation leaves markets living in a paradox or contradiction.
- People use derivatives, in particular call options, because they believe there is too much liquidity chasing too few assets.
- However, derivatives trading is freezing some of that liquidity or sucking it out of the system because of margin deposits.
Figure 11 – Critical intercept between retailers and global options market