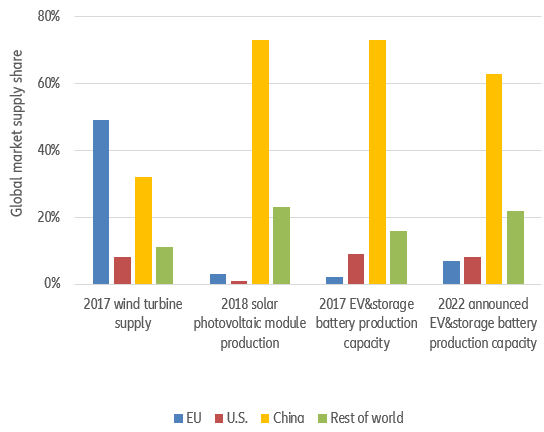
For the EU, US and China, the Covid-19 recovery is an opportunity to accelerate in the race to dominate energy transition industries and boost sustainable growth and job opportunities. All three countries have included sizable green commitments in their stimulus packages, though the US and EU far outpace China in this regard (green share of stimulus at 30% in the US (with Biden’s new proposals), 20% in the EU and 5% in China. Chinese suppliers are currently dominant in the PV as well as the battery markets, while European suppliers have a lead in wind turbines (see Figure 1). Looking at the current construction projects for adding battery production capacities, we see that the battery market is quiet agile, with the EU likely to gain 5% market share by 2022, and China likely to lose 10%.
Figure 1 – Global climate market supply shares for key green technologies
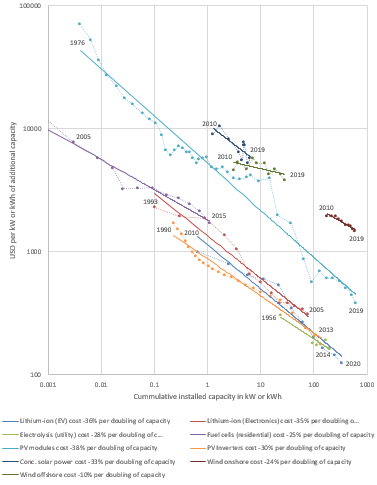
But size matters for success: a large local market is needed to realize the necessary economies of scale and vertical integration opportunities to remain competitive. Figure 2 shows that a doubling of the cumulative produced global capacity results in cost reductions of 10%-25% for wind, 30%-38% for PV components, 36% for EV batteries, 28% for electrolysis and 25% for fuel cells. These cost reductions translate directly to price reductions, for instance in the electricity costs – the so called levelized costs of electricity (LCOE) – of the associated technologies (Roser, 2020) .
What explains these cost reductions? Producing more offers the opportunity to learn how to improve the process. The resulting price decrease leads to additional demand that leads to additional production that leads to additional learning. This learning-by-doing is part of the innovation process that, along with directed research and development, most visibly is documented through patenting activities. Other drivers of cost reduction include economies of scale, innovation incentives and spillovers due to a larger market size and growth-driven vertical integration opportunities. The resulting learning curves or experience curves are historically well documented for widely differentiated goods, with the classical example being Ford’s Model T production that revolutionized the car market. The best known case is probably the computer industry and the corresponding ‘Moore’s Law’ that predicts a doubling of the transistors in a CPU (and a corresponding increase in computing power) every two years.
Governments are also essential. For instance, bringing solar PV from the laboratory to the market required substantial research funding as well the stimulation of early adoption through subsidies to foster the innovation process. While the technology was at first only applied for satellites, it found further niche applications throughout the 1980s. The government feed-in tariff in Germany in the 1990s was particularly important to build a market and with increasing potential, more countries and companies increased R&D funding, patent numbers accelerated and costs fell.
Figure 2 – Experience curves
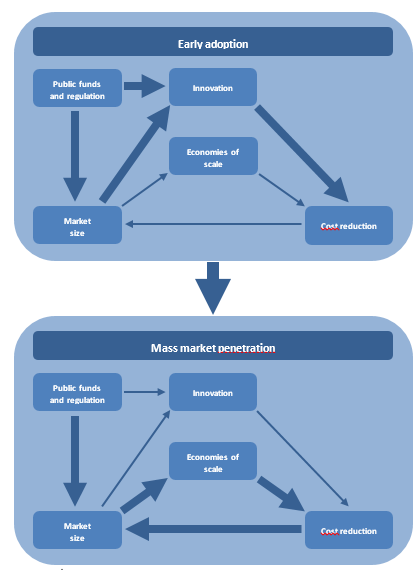
Figure 3 relates to this stage as ‘early adaptation’. But the extension of feed-in tariffs, deployment targets and privileged transmission net access ultimately resulted in mass market penetration and the establishment of solar PV as the cheapest electricity-producing technology at the margin. Now, the relevant issue for efficient market expansion policies is the identification of the dominant mechanisms for cost reduction.
IEA (2020) and Hoppmann (2018) quantify the relative contribution of different resource-push and market-pull measures to cost reductions. As illustrated in Figure 3, there has been a regime switch between the early adopter stage and the mature market stage. In the early stage, two-thirds of the cost reductions in producing solar PV panels were induced by market pull factors: R&D was evenly driven by public research funding as well as by market stimulating policies and to a lesser extent by economies of scale and even less learning-by-doing. Once the mass market penetration was reached in 2001, economies of scale became the dominant source of cost reductions and surpassed the joint effect of R&D motivated by public research funding and by market-stimulating policies.
Figure 3 – Cost reduction cycle
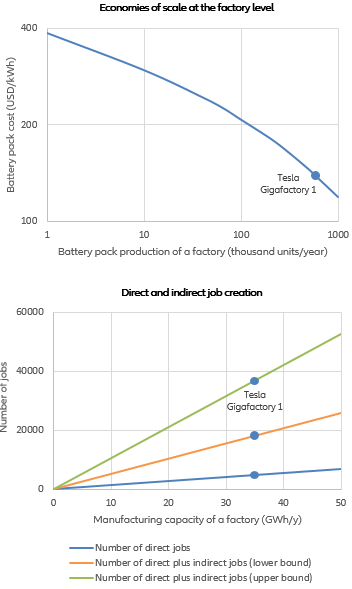
What does this mean for policymakers? Figure 4 provides some insight in the assessment of the European Commission (EC JRC, 2017) on how to achieve competitiveness in the e-mobility and storage battery market. While the analysis focuses on the battery sector, it is representative for other mentioned technologies as well. The figure relates to a single factory, with the upper graph showing the simplified empirical relationship between production volume and production cost and the lower graph the simplified empirical relationship between production capacity in GWh and employment.
Figure 4 – The necessity for giga-factories and vertical integration
In relation to the Tesla Gigafactory 1 that has a production output of 35GWh, or about 580 thousand 60kWh battery packs, this would result in about 5,000 jobs at the factory or up to 35,000 jobs in the vicinity along the value chain. The EC JRC states that the realization of the cost evolution depends on the degree of vertical integration along the battery value chain . This is mainly because products in the segments upstream of cell manufacturing represent commodities in a cost-driven world market, whereas downstream from cell manufacturing they depend on the application and are therefore value-driven: “Enhanced vertical integration – as expected in the gigafactories currently being planned – is expected to decrease the cost ratio between battery packs and cells.” The resulting economies of scale in the electric vehicle sectors haven’t fully materialized in the storage sector because of a lower degree of vertical integration and storage cost are expected to drop accordingly when they do.
In a true circular economy, the advantages of local natural resource deposits - like rare earths – will diminish over time, a trend that could be accelerated by policies supporting recycling and penalizing the (destructive) use of new raw materials. Asian countries have a comparative advantage in vertical integration potential for specific raw material-dependent intermediate products such as cathodes, anodes, separators, and electrolytes. Concentrations of cell manufacturing capacity and upstream supply chains contribute to the current industrial clusters in Asian countries. However, an adequate regulatory environment that results in the usage of recycled materials as economically viable alternatives to new materials could support the establishment of global recycling hubs. These pose an alternative for vertical integration in the battery sector that is not only more sustainable but also provides more job market prospects in superior qualification occupations. To guarantee a level playing field, the incentive structures and obligation to use recycled materials would need to be supported by some kind of resource border adjustment mechanism. For traded goods, this mechanism needs to compensate for the cost differences resulting from different proportions of recycled versus new materials used in regional production chains.