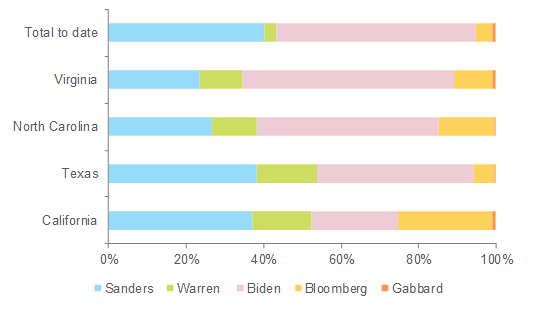
Fourteen states (Alabama, Arkansas, California, Colorado, Maine, Massachusetts, Minnesota, North Carolina, Oklahoma, Tennessee, Texas, Utah, Vermont and Virginia) and two other constituencies voted in the Democrat primary to nominate their party presidential candidate. Five candidates remained in the competition after Klobuchar, Buttigieg and Steyer dropped out and recently turned to endorse fellow moderate Biden in an attempt to unite the centrist voters. Biden (51.2% of delegates to date) was the clear winner (see Figure 1) of this Super Tuesday, while Sanders remains in the race (40% of delegates to date). The lessons of this Super Tuesday are the following:
- Joe Biden and Bernie Sanders have cemented themselves as the front runners for the Democrat nomination
- As expected, Biden won a clear victory in the southern states. He continued to build on the momentum he started in South Carolina and appeared to have won 10 of the 14 states
- Sanders appeared to have won the grand prize of the evening, the liberal state of California with the most delegates (we caution that it will take several days to actually apportion all of the delegates from California)
- Bloomberg and Warren (she finished third in her home state tonight, but claims she will be staying for the chance at a brokered convention) are almost certainly out as they respectively have 4.3% and 3.2% of delegates to date.
- While the night’s outcome almost certainly makes it a two-man race, there are many more big states to go, such as New York, Pennsylvania, Florida, Ohio, and Michigan. It’s far from over, but it appears to be over for everyone except Biden and Sanders.
And the real winner is…public debt
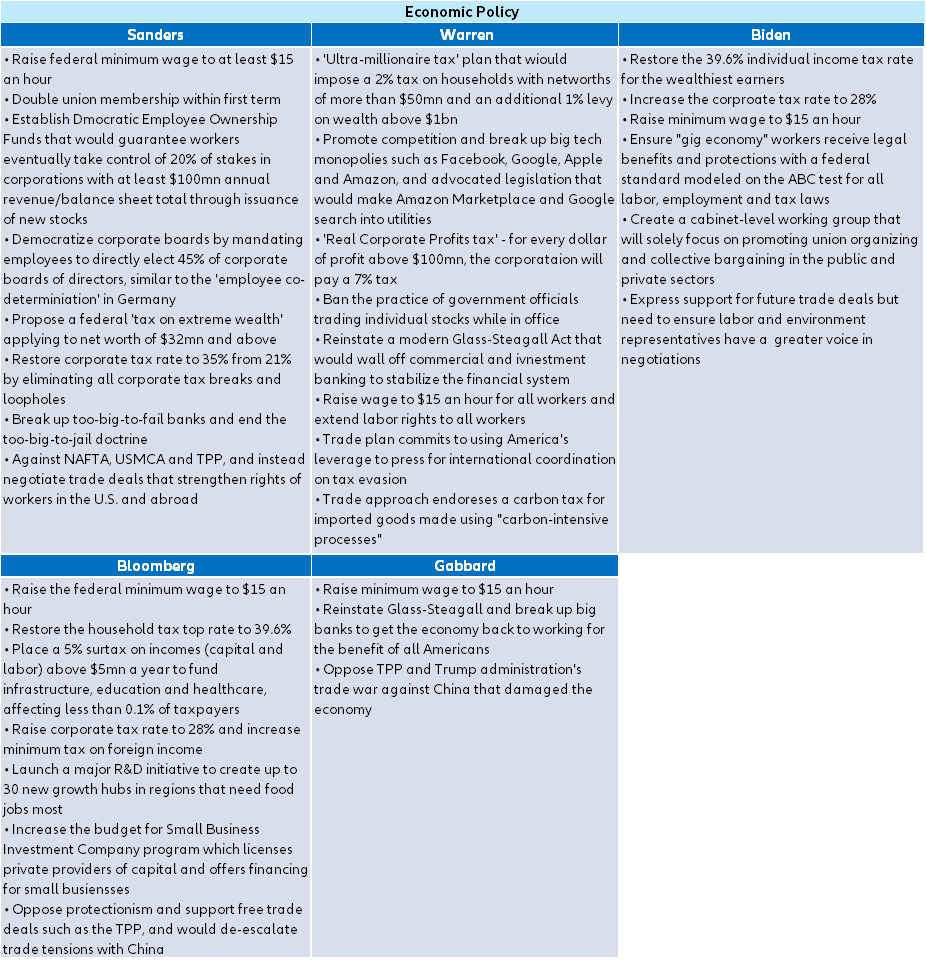
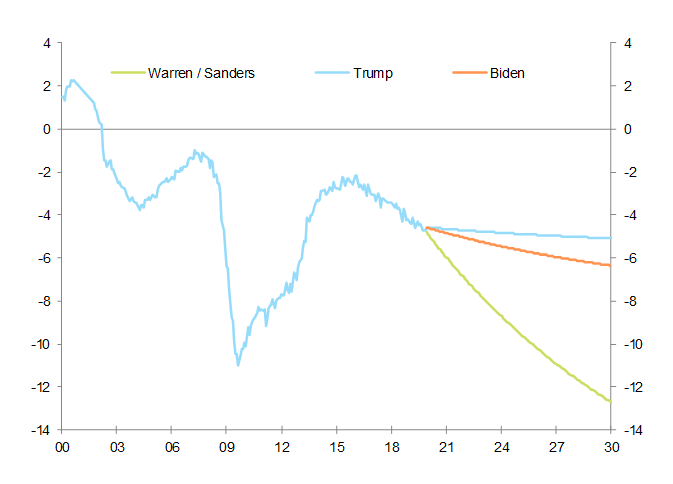
No matter who wins the Democrat nomination (see Figure 2 for the economic programs of Democrat candidates), or even the general election in November, it is certain that U.S. national debt will continue to grow. In fact, even with no changes to the current law, the Congressional Budget Office (CBO) projects that public debt would increase from $17.9T or 80.8% of GDP at the end of 2020 to $31.4T or 98.3% of GDP at the end of 2030. The rising debt is largely because of the major entitlement programs, Social Security, Medicare, Medicaid, and Income Security (welfare), which currently take up 2/3rds of all budget outlays and are projected to rise further. These programs suffer from an inexorably increasing demographic of an aging population benefiting from the programs, without enough younger people paying into them. On top of that, it is political suicide to try to change those programs, so they are unlikely to be cut in any material way. The two most likely candidates, will add on to that debt, even though they do show a marked difference in their platforms and fiscal plans.
Biden’s plans, simply put, include an increase in spending of $3.2T over the next ten years, on top of CBO’s projection of $60.7T. In theory, he also has enough tax hikes to pay for it. Under his plans, the debt would rise only a bit more than current projections. Any increase in the debt load is to be avoided, but Biden’s plans seem like they would have little effect on top of the already planned increases.
Sanders’ plans aim at making enormous changes to the federal government in line with his “social democrat” moniker. He effectively wants to increase government spending by around 70%. He has proposed massive new social programs, including “Medicare for All”, which would cost $17.5T; the “Green New Deal”, which would cost $16.3T; free college tuition, and many more line items. The total is around $40T above current spending over 10 years. Sanders plans to pay for his platform with a plethora of massive new taxes and tax increases, yet it seems that they would fall far short of paying for the spending. If we assume that taxes go up $10T over the 10-year period, Sanders’ programs would add a huge amount to the national debt, making it effectively double to around $60T, or 196% of GDP. This policy would place an unsustainable burden on the U.S. economy.
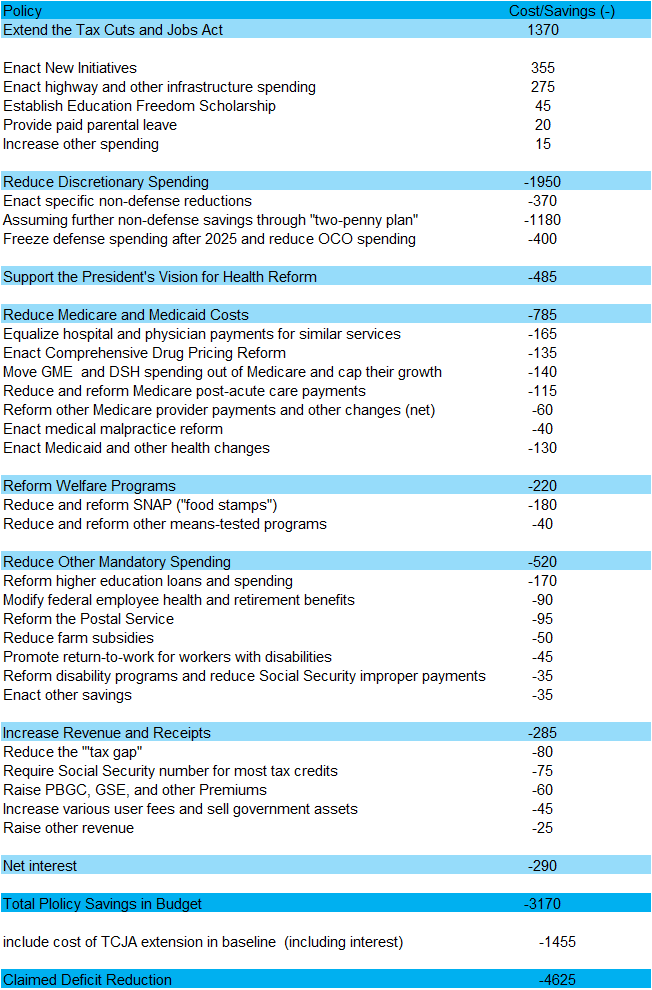
The last fiscal orientations of the White House, as mirrored by the recent release of its FY 2021 Budget, advocate for a deficit reduction by USD 4.6 trillion by 2030. However, underlying assumptions of growth in those projections are probably over-optimistic as they bet on average real GDP growth performance of +2.8% y/y. In a context of muted productivity growth and the aging of the population, this is highly unlikely. There are obviously significant differences between budgetary options contained in these new budget proposals (see Figure 3) and the Democrat proposals. The White House proposes cuts in healthcare, social and education spending in favor of higher military spending and further extension of the 2017 Tax Cuts and Jobs Act (TCJA) beyond 2025.
However, when looking at different programs[1] and combining them with assumptions of the CBO in the baseline scenario (corresponding to the current administration’s orientations), we realize that the current level of public deficit will remain persistently high (Figure 4), whoever wins presidential election. U.S. public debt is likely to remain on an unsustainable path.
The U.S. economy will have to withstand a persistently high level of uncertainty in 2020
The recent years saw the level of uncertainty significantly increase after President Trump decided to opt for a more protectionist stance in his trade policy. The deterioration of trade relations between the U.S. and China triggered a significant deceleration of global trade. The U.S. economy was not immune to the impact of this shock as large U.S. companies remain dependent on foreign demand. As a result, the U.S. investment cycle has progressively lost some momentum despite the resilience of domestic demand. With the impact of the Covid-19 outbreak considered now as high in the election year,we expect the U.S. economy to remain under pressure with a huge level of uncertainty. This is the reason why we expect only +1.6% y/y of growth in 2020 compared with +2.3% y/y in 2019.
On 04 March, the Federal Reserve decided to cut interest rates by half a percentage point in an emergency move designed to bolster the U.S. economy amid the risks posed by the Covid-19 outbreak. This is the first emergency cut since the financial crisis of 2008-09. We expect a further rate cut of 25bp in June, to 0.75%.
Figure 1 – Results of the Democrat Primaries (% of total delegates)

