Show me the money: debunking a couple of myths about excess liquidity 

17 March 2021 

The reflation trade that has engulfed capital markets is largely based on the idea that a lot of money has been, is and will be created in response to the Covid-19 pandemic. According to a balanced view, rapid money growth is a prerequisite for inflation to pick up. According to a more extreme view, it would even be a sufficient condition. But how fast is the stock of money growing? This question is easy to answer at a national level as countries - or monetary unions like the EMU - typically publish monthly data on the money created by their central banks (the monetary base, M0) and by their banking systems (broad money, M2 or M3). As shown in Table 1, money grew rapidly in the largest economies in 2020, especially since the outbreak of Covid-19.

Table 1: Broad money growth in the largest economies in 2020 (y/y%) 

Table 1: Broad money growth in the largest economies in 2020 (y/y%)
Sources: Refinitiv, Allianz Research. 
But in a world where monetary capital is largely free to move from one place to another, the right questions to ask are rather the following: how fast is the global stock of money growing? Is there a discrepancy between narrow and broad money growth? Which countries or regions contribute the most to money growth? And what about money velocity, the often overlooked variable that can amplify or dampen the impact of money growth?

Measuring global money poses four problems. First, the definition of money is elusive. As Walter Bagehot quipped: “Men of money know how to count; what to count they do not know”. And, according to Goodhart’s law, as soon as a certain money aggregate becomes a policy variable, experience shows that regulatory arbitrage gives birth to a new and generally broader aggregate. For this reason, it seems appropriate to monitor both extremes of the money spectrum: the monetary base (i.e. currency and bank reserves at the central bank) and broad money (currency, bank deposits and money market funds).  
Second, while the definition of the different money aggregates is relatively standardized, not all countries publish the same data over the same period: for example, since 2006, the Federal Reserve has stopped tracking M3, the broadest aggregate monitored by the ECB. Adding M2 in one country to M3 in another one may look like adding apples and oranges. But as the distortion it introduces is almost constant through time, it is an acceptable one.

Third, there is a trade-off between the number of countries taken into consideration and how far back in the past one can aggregate national data. Bearing this trade-off in mind we look at China, Canada, the EMU, Japan, the UK and the US for the monetary base, and add Australia, Brazil, Hong Kong, India, Indonesia, Malaysia, Mexico, Philippines, Singapore, South Africa, South Korea, Sweden, Switzerland, Taiwan and Thailand for broad money. This selection makes it possible to aggregate national data from 1986 onwards.

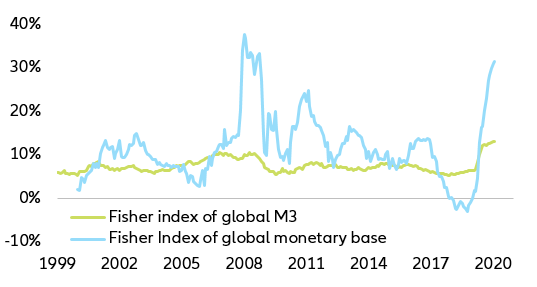
Last but not least, since we want to measure the rate of growth of global money, we must make sure that changes in the relative prices of its components do not blur our measurement. Whichever currency we choose as the accounting unit, say the USD, we must ensure that fluctuations in the exchange rates of the Euro, the Chinese Yuan, the GBP etc to the USD do not impact our measurement. Failing to do that, a weak dollar would artificially boost global money growth. As it would, by the same token, artificially boost the global GDP measured in USD, it would not necessarily mean that the supply of money has increased relative to its demand. Formally, the problem of eliminating the impact of currency movements is akin to measuring the rate of inflation of a basket of goods, the composition of which changes over time, a problem solved by Irving Fisher in 1927 with his eponymous price and volume indices.    
The OECD does not provide such a Fisher volume index for the monetary base at the OECD level, but it does so for M3. According to this index, the OECD M3 was growing at an annual rate of +18.4% in November 2020, up from +5.8% in February. However, by design, this index does not account for money growth in non-OECD member countries such as Brazil, China, Hong Kong, India and Taiwan. Yet, these countries, China first among them, are not small players when it comes to global liquidity. To the best of our knowledge, neither the IMF nor the BIS compute Fisher volume indices for the monetary base or broad money at the global level. This is why we have constructed the following proprietary indices.

At the end of January 2021, global broad money stood at USD106.7trn. As shown in Table 2, five of the 21 countries selected accounted for about 80% of global money. In money matters, too, the 80-20 rule, also known as the Pareto principle, seems to hold.  

Table 2: Shares of global broad money

Table 2: Shares of global broad money
Sources: Refinitiv, Allianz Research. 

At the same date, global broad money was growing at an annual rate of +13.2%, the highest rate posted since 1986 (during the Great Financial Crisis, global money growth peaked at “only” +10.5%). 

This being said, this rate of 13.2% is about five percentage points slower than the OECD M3, a differential that highlights the role of non-OECD members in the provision of global liquidity. Another noteworthy contrast is that between the rate of growth in global broad money (+13.2%) and the much higher rate of growth of the global monetary base (+31.6%), as shown in Figure 1.

Figure 1: Annual rates of change of Fisher indices of the global monetary base and global broad money (in y/y%)

Figure 1: Annual rates of change of Fisher indices of the global monetary base and global broad money (in y/y%)
Sources: Refinitiv, Allianz Research. 

This second differential highlights the challenge of broad money creation in a fractional-reserve banking system. In such a system, broad money creation also depends on both the commercial banks’ ability and willingness to lend and their clients’ ability and willingness to borrow (during the Great Financial Crisis, growth in global broad money peaked at less than a third of growth in the global monetary base: +37.8%). The third important observation: global money growth slowed markedly during the second half of 2020. The three- and six-month annualized rate of growth in global broad money peaked in May at +28.6% and June at +19%, respectively; they have now slowed down to +8.2%. The same holds true of the global monetary base: after peaking at +71.6% in May, its three-month annualized rate of growth has slowed down to +28.1%. All this suggests qualifying the view according to which the printing press has been running at a torrid pace. All the more so that in one large country at least, the US, the operations of the Treasury have distorted money aggregates.

The Treasury General Account (at the New York Fed) is the primary operational account of the US Treasury at the Federal Reserve. Virtually all US government disbursements are made from this account. Some tax receipts are deposited in this account, and it is also used to collect funds from the sales of Treasury debt. By convention, the reserves held by the Treasury at the Fed are not part of the US monetary base, nor are they part of US M2. This accounting convention is justified by the fact that historically the balance on this account has been both limited and stable. However, between March 2020 and June 2020, it swelled from USD400bn to USD1,800bn, as shown in Figure 2. It now stands at USD1,400bn and it is expected to fall back to USD500bn by the end of April as Biden’s stimulus plan is implemented.

Figure 2: Federal Reserve’s gross and net claims on the US Treasury (in USD bn)

Figure 2: Federal Reserve’s gross and net claims on the US Treasury (in USD bn)
Sources: Refinitiv, Allianz Research. 

It is not clear why the US treasury has accumulated such a large cash balance by overfunding its deficit to the tune of about USD1trn between April and December 2020. Admittedly, according to classic cash management principles, the temporary increase in the Federal outlays caused by the Covid-19 crisis justified a temporary increase in the Treasury’s cash balance, but definitely not a prolonged quadrupling.  Admittedly, too, the Treasury may not have expected the squabbles between the executive and legislative branches of the US government or within the Congress between Democrats and Republicans to last for so long. Out of fear of losing market access at favorable conditions, the Treasury would have therefore heavily prefunded the forecasted federal deficit. But if that really was the Treasury’s motivation, it should have seized the opportunity provided by very low long-term nominal interest rates to extend the average maturity of its debt. Yet, exactly the opposite happened: from February to September 2020, the average maturity of the US Federal debt fell by 15%, from 66 to 56 months.

What is clear is the impact of the swelling of the Treasury General Account on both the US monetary base and US M2. Everything else being equal, it has dampened not only the growth of bank reserves, and therefore the growth of the monetary base, but also the growth of private deposits at US commercial banks.  Had the Treasury spent those reserves instead of hoarding them, they would have ultimately landed, by and large, on the commercial banks’ deposit accounts at the Fed. As a counterpart to these reserves, US commercial banks would have issued more deposits to their customers and broad money growth would have been about 1pp higher (+14.4% vs +13.2%).

Had the Treasury and the Fed willingly cooperated to discreetly, but effectively, sterilize about half of the Fed’s post-Covid balance sheet expansion, they would have striven to put a lid on the Fed’s net lending to the Treasury (Treasuries holdings minus Treasury General Account); they would not have operated differently . As the Treasury is now dishoarding its reserves, everything else being equal, in the absence of counterbalancing operations, we should expect banks’ reserves, the monetary base and broad money to grow more rapidly. Among the things that may not be equal, there is what US private agents will do with the money they receive from the US Treasury. If they favor paying back bank loans over spending on goods, services and securities, we could see a slowdown in M2. Since it is true that loans make deposits, the opposite is also true: repayments destroy deposits.

What should we take away from this discussion of the US Treasury General Account? It is quite easy to be misled by headline money numbers, to overestimate or underestimate money growth and therefore to underestimate the uncertainty surrounding the outlook for inflation. Variations in the US Treasury balance are certainly important at the US level, but, given the size of global broad money, they are too small to have a material impact on the hierarchy shown in Table 2. For the same reason, they do not significantly alter the largest countries’ respective contributions to the growth in global broad money shown in Table 3.
 
Table 3: Contributions to growth in global broad money
Sources: Refinitiv, Allianz Research. 
Here again, we encounter the 80-20 rule: about 20% of the selected countries currently contribute to 80% of the growth in global broad money. This being said, today the first contributor to global money growth is no longer China, but the US, with 32.6% of the total. And, more than during the Great Financial Crisis, money growth is now concentrated in the three or four largest economies, as shown in Figure 3.

Figure 3: Contributions to growth in global broad money (in y/y%)
 Figure 3: Contributions to growth in global broad money (in y/y%)
Sources: Refinitiv, Allianz Research. 
What could this mean? Probably that monetary policy mistakes in either one of these four economies are more likely than ever to have international consequences. As the US leads global money creation, should we worry about the external value of the US currency? If the past, at least until 2009-2010, is any guide, the answer is no, not necessarily, as shown in Figure 4. Paradoxical or counterintuitive as it may be, previous periods during which the US contribution to global money growth has increased have more often than not coincided with a period of appreciation for the USD. This could make sense if market participants interpret rapid US money growth relative to the rest of the world as heralding a period of US economic outperformance. However, the weakening of this relationship after 2009-2010 may reflect rising challenges to the dollar’s supremacy.

If the velocity of money was constant, it would be enough to focus on its quantity, subject to the many caveats discussed above. But it was definitely not constant in 2020, irrespective of the way global nominal GDP and global broad money are measured, as shown in Table 4.

Table 4: Global nominal GDP, broad money and money velocity in 2020 (in y/y% rate of change)  
 Table 4: Global nominal GDP, broad money and money velocity in 2020 (in y/y% rate of change)
Sources: Refinitiv, Allianz Research. 
The fall in money velocity experienced in 2020 is part of the long-term trend shown in Figure 5. Both this long-term trend and its recent acceleration reflect an increase in the demand for money for precautionary purposes. Put differently, the propensity to hold idle money balances has increased. Private agents have hoarded money rather than spent it. A similar development took place during the Great Financial Crisis. Hoarding is what agents typically do when inflation expectations decline and perceived uncertainty increases. Dishoarding starts when economic agents hold more money than they desire, when there is excess liquidity in the economy. According to our proprietary estimates of the demand for money, this was the situation prevailing at the end of last year in the EMU, the US (Treasury General Account excluded), Japan and the UK, but not in China.   However, as the current level of excess liquidity is moderate, as shown in Table 5, it should not trigger a sharp rise in the velocity of money. In the unprecedented scenario where money velocity would instantly revert to its long-term trend, it would instantly add 8pp to the growth of global nominal GDP. In front of this very implausible assumption, there is the reality of still large output gaps that could absorb a good deal of such a demand shock before pushing inflation significantly up.

Table 5: Monetary imbalance at year-end 2020 (% of money supply)
Sources: Refinitiv, Allianz Research. 
A gradual reversion of money velocity to the downward trend visible on Figure 5 seems to be the most likely scenario. Put differently, no matter how fast global broad money is growing, its velocity is still the missing link to inflation.

Figure 4: US contribution to growth of global broad money and external value of the USD  
Figure 4: US contribution to growth of global broad money and external value of the USD
Sources: Refinitiv, Allianz Research. 
Figure 5: Estimated transactions-velocity of global broad money
Sources: Refinitiv, Allianz Research.