French and German savers have many things in common: Their level of financial assets per capita is similar and its development over the last decade has been almost identical. There is, however, one striking difference: The return on financial assets is way higher in France, reflecting different portfolio compositions. The consequences for consumption are substantial, resulting in a "shortfall" of around EUR800bn in consumption in Germany over the last decade, or at least around 5% of annual consumer spending. 

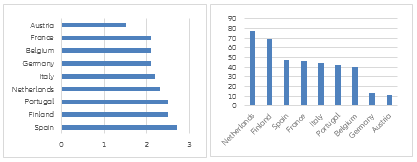
The wealth gap in Europe has widened in the last decade. Household assets have grown faster in the richer countries – above all in the Netherlands – while southern European countries are lagging behind in terms of both wealth levels and growth (see Figure 1). Looking at France and Germany, in 2019, per capita financial assets in France were EUR84,320, just above EUR77,310 in Germany. Growth rates since the Great Financial Crisis have also been very similar: +4.3% per year in Germany compared to +4.2% in France. This puts both countries in the midfield in Europe, well ahead of Portugal and Spain but also well behind the Netherlands and Belgium. 

Finland is the exception to the growing divergence: In 2019, it had almost caught up with Italy, reflecting an impressive pace of growth; back in 2009, per capita financial assets of Finnish households were still nearly EUR19,000 below those of Italian ones. 

Figure 1 – Financial assets per capita*, in EUR and CAGR 2010-2019 in %

Figure 1 – Financial assets per capita*, in EUR and CAGR 2010-2019 in %

*without other equity

Sources: Eurostat, Allianz Research.

What is behind these different developments? A key driver of asset growth is the return, i.e. the investment income generated by financial assets and the value gains in the portfolio. There are major differences in returns across Europe. The Netherlands and Finland – the two fastest-growing countries – take the lead by a wide margin; Austria and Germany, on the other hand, are at the bottom, with returns less than half than those of the frontrunners (see Figure 2). However, even after deducting inflation, returns remain positive – albeit very meagre: For Austria, the real return on financial assets has averaged at just 0.5% over the last ten year, and the figure is 1.4% for Germany. What is also striking when comparing nominal returns, however, is the large difference of around 150 basis points between Germany and France; the real return in France (3.0%) is more than twice as high as in Germany.

Figure 2 – Nominal returns on financial assets*, average 2010-2019, in %

Figure 2 – Nominal returns on financial assets*, average 2010-2019, in %

*without other equity

Sources: Eurostat, Allianz Research.

Investment income, mainly interest and dividends, cannot be blamed for low returns. Here the differences are only slight, which is hardly surprising since all European households operate in the same interest rate environment, and the dividend policies of competing European companies are not fundamentally different. In fact, Germany and France show exactly the same return if only investment income is taken into account (see Figure 3). Spain and Portugal recorded relatively good performance in this respect mainly because during the euro crisis, banks still paid relatively high interest rates on deposits to secure a cheap and open source of funding. Now, however, there is no longer any sign of this, with interest rates approaching zero everywhere. For example, the average interest rate on all bank deposits in Portugal in 2019 was 0.13%, compared with 0.17% in Austria and 0.16% in Germany. Spanish households receive on average only 0.05% interest on bank deposits. 

Thus the main reason for the large differences in returns is to be found in the value gains of the portfolios, i.e. rising asset prices. This is also evident in another illustration: the right panel of Figure 3 shows the share that these value gains have in the total growth of assets. The range extends a lean 11% in Austria and 13% in Germany to 77% in the Netherlands. In other words, in Austria and Germany, almost 90% of wealth growth is driven by personal saving efforts, whereas in the Netherlands (but also in Finland) markets i.e. rising asset prices does the heavy lifting.

Figure 3 – Nominal returns on financial assets*, only investment income (left panel) and share of value change in asset increase, average 2010-2019, in % (right panel)

Figure 3 – Nominal returns on financial assets*, only investment income (left panel) and share of value change in asset increase, average 2010-2019, in % (right panel)

*without other equity

Sources: Eurostat, Allianz Research.

What lies behind these striking differences in value gains is simply the portfolio structure: A higher share of capital market products that could profit from the stock market boom of the last decade was decisive for a high return. This applies primarily to Finland, which has by far the highest share of listed and unlisted equities at just under 33%, and the Netherlands, whose households – as a result of the quasi-obligatory occupational pension scheme – hold 61% of their financial assets in the form of pension funds, which traditionally hold a high proportion of shares. At the other end of the scale are Portugal and Austria, where more than 50% of financial assets consist of cash and bank deposits (see Figure 4). The fact that Portugal still has a better total return than Austria (3.1% vs. 2.4%) is exclusively due to the higher interest rate on bank deposits mentioned above.

Looking at the portfolio structure, the difference between France and Germany is also explainable: German households have a significantly higher share of cash and bank deposits (+12pp), but a lower share of equities and investment funds (-2.4pp). The example of France, which has the third-highest return on financial assets (4.3%) after the Netherlands and Finland, and whose households also have by far the highest share of insurance in their portfolios, also helps to dispel the prejudice that insurance policies are yield-killers in times of low interest rates. Actually, in all the countries in our sample, insurance obtained a yield of between 3.5% and 5% on average over the last ten years. Thus, it is no miracle that the share of insurance in portfolios usually remained relatively stable, and in countries such as Italy and Finland even strongly increased.

Overall, however, the changes in the portfolio structure are relatively modest in view of the dramatic changes in the interest rate landscape (see Figure 4). Take bank deposits, for example: their share has remained largely stable, with only Finland and the Netherlands seeing a significant decline – in other words, precisely the two countries that also generate the highest returns. (Portugal and Italy, on the other hand, even now show a higher share of bank deposits than ten years ago). In contrast, the share of bonds has declined in all countries, although their importance – with the exception of Italy – was relatively modest even before the crisis. At the same time, the share of investment funds has slightly increased in many countries – often at the expense of direct ownership of equities – reflecting their growing popularity, especially in the case of index funds.

Figure 4 – Asset classes as a percentage of total financial assets*

Figure 4 – Asset classes as a percentage of total financial assets*

*without other equity

Sources: Eurostat, Allianz Research.

These differences in portfolio structure and the resulting different returns also have far-reaching macroeconomic consequences: They result in a "shortfall" of around EUR800bn in consumption in Germany over the last decade, or at least around 5% of annual consumer spending.  After all, low returns mean that the growth of financial assets is driven only to a lesser extent by asset price increases. This has ramifications on saving behaviors: If households see their savings increasing decently by the invisible hand of markets, they are more inclined to use their investment income for consumption purposes, say, for buying the larger TV set they longed for. On the other hand, if savings hardly increase, households are more likely to top them up. In order to achieve their own saving targets, these households must increasingly draw on parts of their earned income, which are then no longer available for consumption. 

Figure 5 shows this interrelation. In most countries, parts of investment income are also used for consumption purposes, first and foremost in the Netherlands. In Germany and Austria, on the other hand – the two countries with the lowest returns – the investment income is not sufficient to reach one's own saving goals: savings from earned income have to be added. With just under EUR10,000 per capita over the last ten years, German households have fully lived up to their reputation as the "world champions of saving". These saving efforts explain why German and, to a lesser extent, Austrian households are still achieving decent growth in financial assets despite low returns. At the same time, however, they also mean that over the last ten years there was a total "shortfall" of around EUR800bn in consumption in Germany, or at least around 5% of annual consumer spending.  Surprisingly, France is the third country in this league of saving champions, even though returns on financial assets are much higher. At just under EUR2,000 per capita over the last decade, however, these additional saving efforts are much lower. Nevertheless, the savers on both sides of the Rhine seem to be more similar in their saving ambitions – or stinginess – than often assumed.

Figure 5 – Use of property income for saving and consumption and additional savings out of earned income, per capita in EUR, cumulated sum 2010-2019

Figure 5 – Use of property income for saving and consumption and additional savings out of earned income, per capita in EUR, cumulated sum 2010-2019
Sources: Eurostat, Allianz Research.
The consequences for policymakers are clear. In order to bolster domestic demand – as Germany has often called for – it may not be necessary for Germans to save less – but they must do so differently. So far, German households have not gone beyond tentative approaches. For a little more courage, a look across the Rhine would be helpful. 
Arne Holzhausen
Head of Wealth, Insurance and Trend Research
Roman Alexander Niklas 
Research Assistant