Executive Summary

In general, property and casualty insurance demand has reflected the development stage of an economy: The higher the GDP per capita, the higher the gross written premiums per capita and premium income as a percentage of GDP, indicating a positive correlation between economic and P&C insurance market development. However, against the background of new technologies and distribution channels, changing customer behavior and demographic change, the question arises: Does this correlation still hold or have other explanatory variables already replaced GDP as the decisive factor for insurance market growth in recent years?

Our analysis of the P&C insurance market developments in 61 countries between 2000 and 2019 shows that:

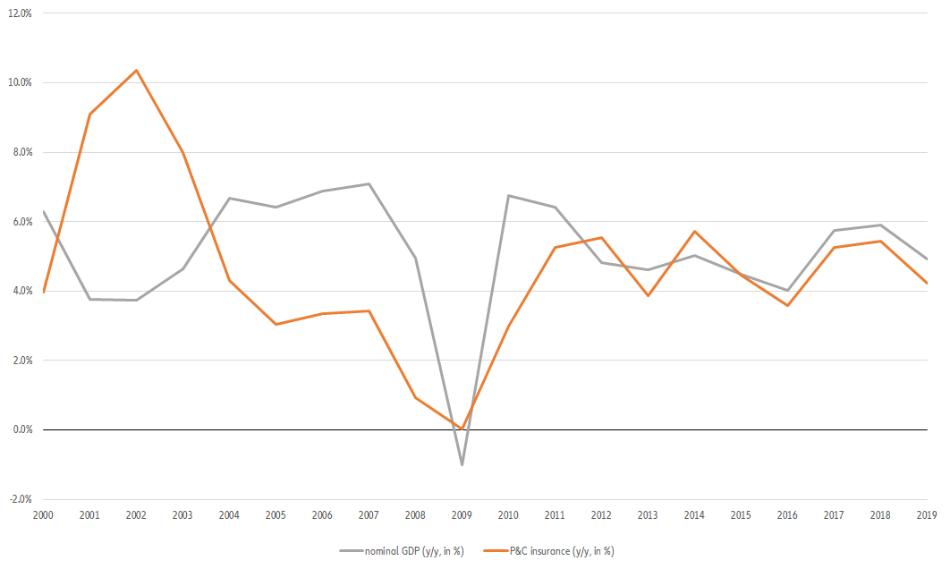
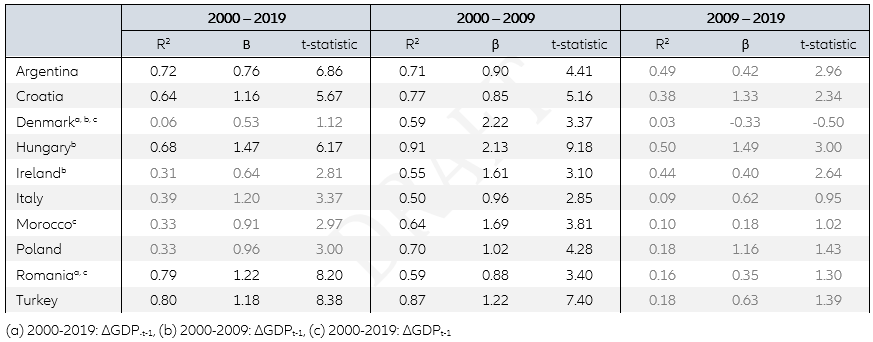
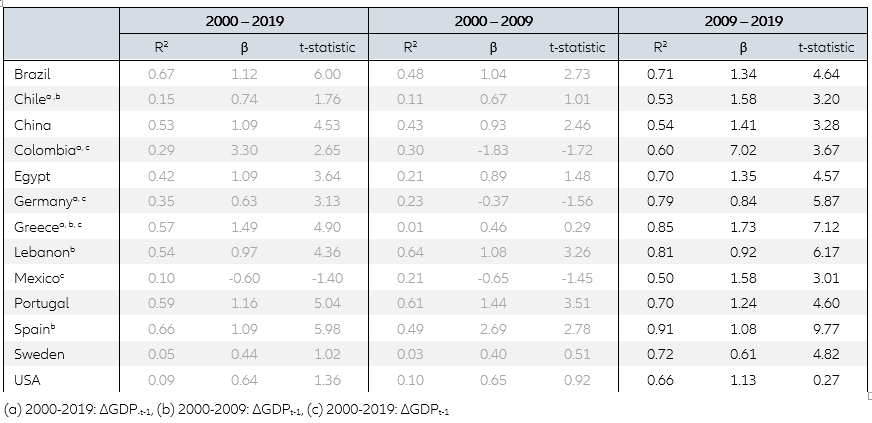
  • Nominal GDP growth explains 61% of global gross written P&C insurance premium development between 2009 and 2019. At the country level, however, results are more dispersed: In 30 of the 61 analyzed countries, the explanatory strength of nominal GDP is higher in the first decade; in 31 it is higher in the second decade and only in 25 of the countries is the explanatory power of GDP above 50%. The maturity level of an insurance market has no influence on the explanatory strength of nominal GDP growth.
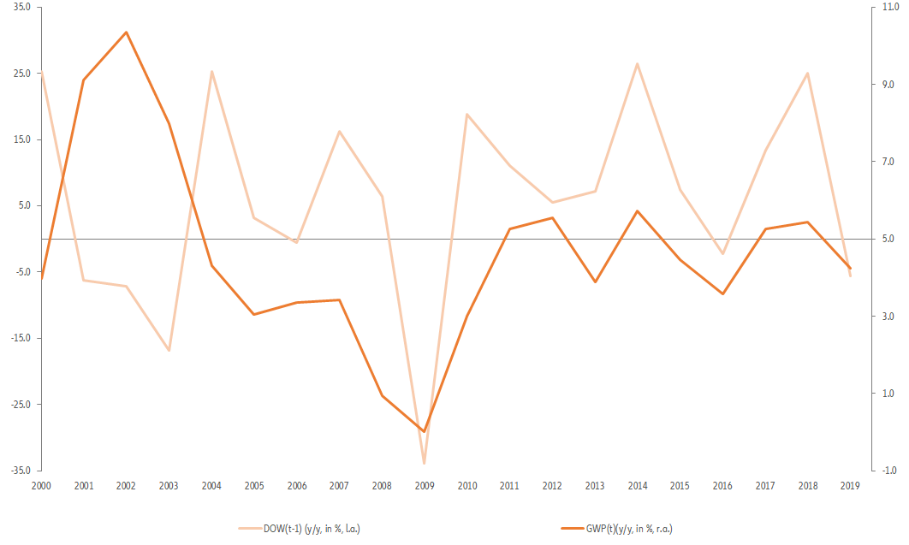
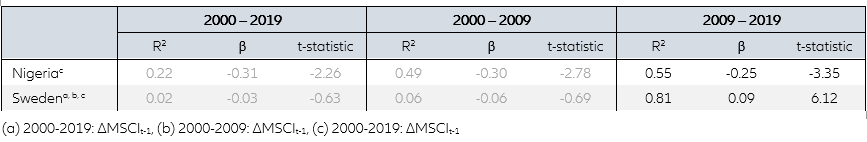
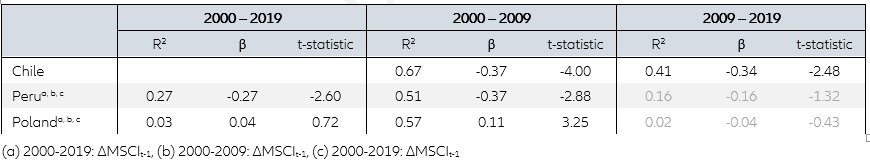
  • The development of the Dow Jones index explains 64% of global premium growth between 2009 and 2019 and that of the MSCI World Index 40%, albeit in each case with a time lag of one year. The correlation of total P&C premium growth and stock market developments in the second decade is positive. 
  • There is no decisive exogenous factor for the development of motor insurance premium income. Even the number of motor vehicles was in most cases not the best indicator for motor insurance premium growth.
  • In most countries, property premium growth since 2000 was influenced by national stock market developments, though the explanatory strength of this exogenous factor was rather low. In the first decade, private consumption expenditures were the dominating explanatory variable, while we could not identify a decisive exogenous factor for the development in the second decade. 
In general, property and casualty insurance demand reflects the development stage of an economy. The higher the level of prosperity in a country, measured in GDP per capita, the higher the insurance density and penetration, i.e., gross written premiums per capita and in percent of GDP. This indicates a positive correlation between economic and P&C insurance market development. However, against the background of new technologies and distribution channels, changing customer behavior and demographic change the question comes up, how strong this correlation still is and if there are other explanatory variables that might have replaced GDP as decisive factor for insurance market growth in recent years.
 
In order to answer this question, we run single linear regression models with GDP and other various exogenous factors. First for the total gross written premium income at global and country  level, then for different lines of business, namely motor and property insurance, in ten countries. Furthermore, we analyzed not only the development over the whole time period since the turn of the century but also split it into two sub-periods: the first ten years up to the financial crisis from 2000 to 2009 and the second decade between 2009 and 2019. In all cases we run the regression model not only with current but also lagged values of the respective explanatory variable.
 
However, our analysis of potential influencing factors beyond GDP had to be confined to measurable explanatory variables for which time series of at least twenty years were available. We chose the MSCI World index, the respective national stock market benchmark indices and 10-year benchmark bonds, consumption expenditures and disposable income of private households, the number of new car registrations, the total number of vehicles and in one case the number of mileage per year. Of course, factors like financial literacy and the access to financial services, changes in legislation or the occurrence of natural disasters are important for insurance demand, while market regulation, competition and last but not least interest rate and capital market developments influence insurance prices and supply. But very slow changes or one-time events can hardly be modeled or forecast, while data about price developments is not available in most countries.
In order to analyze the impact of nominal GDP growth on P&C premium development in general we used a single linear regression model with the sum of P&C premium income and nominal GDP of the 61 countries  as proxy for the global P&C insurance market and economic development. For the analysis of the influence of capital market developments on global premium growth on premium development we chose the MSCI World index and the Dow Jones index as well as the US treasury 10-year benchmark bond  as explanatory variables.

The correlation of nominal GDP and total P&C premium growth
 
When taking into account the whole time period from 2000 to 2019, our model shows no correlation at all between GDP growth and insurance market development. However, the results look different when running the regression model for each of the two decades separately.
 
In the first decade, which was marked by the terrorist attacks of September 11th and the bursting of the tech bubble, GDP growth explained only 23% of insurance premium development, albeit with a time lag of one year and a negative sign. While P&C insurance premium growth peaked at more than 10%, the world economy tumbled in the aftermath of these events. Thus, in the time span from 2000 to 2005, the two variables were almost perfectly negatively correlated, with an R2 of 95%. In the second half of the first decade, when the world economy started to recover, the development of the global P&C market and GDP growth were more in line and also positively correlated, with R2 amounting to 80%.
 
For the second decade the regression results were markedly higher: R2 was 61% for the whole time period. The correlation was strongest in the second half of the decade: In the sub-period between 2015 and 2019, nominal GDP growth explains more than 90% of premium growth (see Figure 1).
 
Figure 1: GDP and P&C GWP growth (nominal, in %)
Sources: National financial supervisory authorities and insurance associations, IMF, Refinitiv, Allianz Economic Research.
Although the result is rather obvious at the global level with respect to the strength of the correlation between GDP and premium growth before and after the financial crisis, at country level the results are more dispersed. We observe the same development pattern in only 31 of the 61 countries, while in the others the correlation was stronger in the first decade. The GDP development explained at least 50% of insurance premium growth over the entire time period only in 13 countries, namely Argentina, Brazil, Bulgaria, China, Croatia, Greece, Hungary, Lebanon, Portugal, Romania, South Africa, Spain and Turkey, albeit in the cases of Greece and Romania with a time lag of one year. In 14 countries, the R2 values for the whole time period ranged between 27% and 42% and in 24 it was even below 10%.
 
Unfortunately, the results are not significantly better when the two sub-periods are analyzed separately. The correlation was in most cases rather weak: Only in 10 of the 30 countries  where the explanatory strength of nominal GDP was stronger in the first decade than in the second, the R2 values were 50% or higher (see Table 1). The insurance penetration in these countries ranged between 0.9% in Romania and 3.0% in Denmark.
 
Table 1: Test: ∆P&C = α + β*∆GDPt and ∆P&C = α + β*∆GDPt-1
 Table 1: Test: ∆P&C = α + β*∆GDPt and ∆P&C = α + β*∆GDPt-1
Sources: National financial supervisory authorities and insurance associations, IMF, Refinitiv, Allianz Economic Research.
The same holds true for only 13 of the 31 countries , where regression results were higher in the second decade. Albeit, among these are some of the 10 biggest insurance markets of the world, like the USA, China, Germany and Spain (see Table 2). The combined premium income of these 13 countries accounted for more than 60% of the 61 countries’ total premium income in 2019, thus influencing the outcome at the global level markedly. The insurance penetration in these 13 countries ranged from 0.3% in Egypt to 3.2% in the US.

Table 2: Test: ∆P&C = α + β*∆GDPt and ∆P&C = α + β*∆GDPt-1
 Table 1: Test: ∆P&C = α + β*∆GDPt and ∆P&C = α + β*∆GDPt-1
Sources: National financial supervisory authorities and insurance associations, IMF, Refinitiv, Allianz Economic Research.
Thus, at the country level, idiosyncratic influences play a bigger role than at the global level where they might cancel each other out to a certain degree.

The correlation between capital market developments and total P&C premium growth

Like in the case of nominal GDP, for the entire period and the first decade, the models showed a rather weak influence of capital market developments on global P&C premium growth. In contrast, for the 10-year period from 2009 to 2019, the development of the US treasury 10-year benchmark bond and of the MSCI World index explained in each case around 40% of the gross written premium development. However, in the case of the MSCI World index it was with a time lag of one year (see Figure 2).

Figure 2: Differing influence of bond and stock market developments
Table 3 Test: ∆P&C = α + β*∆MSCIt and ∆P&C = α + β*∆MSCIt-1
Sources: National financial supervisory authorities and insurance associations, IMF, Refinitiv, Allianz Economic Research.
However, the Dow Jones index was the strongest explanatory variable, with a R2 of 64% for the time period between 2009 and 2019, albeit also with a time lag of one year (see Figure 3). Like in the case of the MSCI World index, the model showed a positive correlation between premium growth and stock market developments in this time period, supporting the hypothesis that rising stock markets are an indicator for strong economic activity and thus spurring demand.  The development of benchmark bond yields and premium growth, however, were negatively correlated: Falling yields are not only a sign for a subdued economic outlook but could also lure more capital into (re)insurance markets, depressing prices.

Figure 3: Premium growth follows stock market developments
Sources: National financial supervisory authorities and insurance associations, IMF, Refinitiv, Allianz Economic Research.
Like in the case of the influence of GDP growth on P&C market developments, we also found marked differences with respect to the influence of capital market developments at the country level when analyzing the two decades separately. Only in one country, Chile, was the R2 for the entire period above 50%.
 
In 33 countries, the correlation was stronger in the second decade, above all in Sweden and Nigeria. In Sweden, the development of the MSCI index explained 81% of P&C insurance growth between 2009 and 2019 and in Nigeria 55%, albeit here with a time lag of one year (see Table 3). However, in most other countries, the explanatory level of the development of the MSCI World index was rather low: In 10 countries  the R2 values ranged between 26% and 44% and in the remaining 21 countries  it was below 20%.

Table 3 Test: ∆P&C = α + β*∆MSCIt and ∆P&C = α + β*∆MSCIt-1
Sources: National financial supervisory authorities and insurance associations, IMF, Refinitiv, Allianz Economic Research.
In the other 28 countries, we found a stronger correlation in the first decade. However, only in three of them, Chile, Peru and Poland, did the development of the MSCI World index explain more than 50% of insurance premium growth between 2000 and 2009 (see Table 4). In eight of these countries , the R2 values ranged between 25% and 49%, while it was below 20% in the remaining 12 countries.

Table 4: Test: ∆P&C = α + β*∆MSCIt and ∆P&C = α + β*∆MSCIt-1
 Table 4: Test: ∆P&C = α + β*∆MSCIt and ∆P&C = α + β*∆MSCIt-1
Sources: National financial supervisory authorities and insurance associations, IMF, Refinitiv, Allianz Economic Research.